Why probability should be converted to logarithm of odds (logit) in logistic regression analysis?

In logistic regression analysis, probability is converted to odds, p/(1-p), and odds is converted to logarithm. Binomial distribution, either event of interest happens or doesn’t happen, is analysed by multiple regression analysis.

Probability is between 0 and 1. Logarithm of odds (logit) diverges from minus infinity to plus infinity. See charts to understand.

Probability is real between 0 and 1. Take probability horizontal axis and odds vertical axis, respectively. Vertical axis ranges from 0 to infinity, as following chart.
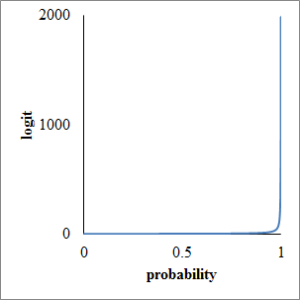
Fig1. probability and logit
Fig1. probability and odds

Next, take odds horizontal axis and logarithm of odds vertical axis, respectively. Vertical axis ranges from minus infinity to plus infinity as following chart.
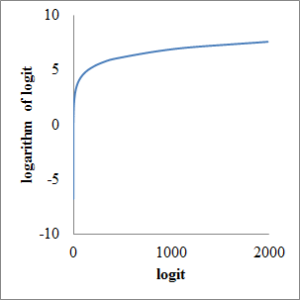
Fig2. logit and logarithm of logit
Fig2. odds and logarithm of odds (logit)

At last, take probability horizontal axis and logit vertical axis, respectively. Although probability ranges only from 0 to 1, logit diverges all real number as following chart.
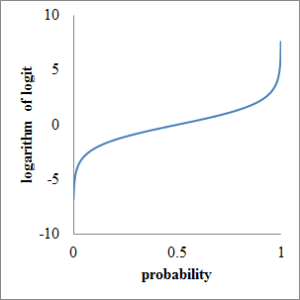
Fig3. probability and logarithm of logit
Fig3. probability and logit

ロジスティック回帰分析における確率から対数オッズ(ロジット)への変換の意味

 ロジスティック回帰分析においては確率pをオッズ p/(1-p) に変換し,更にオッズの対数(ロジット)を取って回帰分析を行います.この意味を少し考えました.元々は二項分布と言って,ある目的とする事象が起きるか起きないかいずれかの値しか取らない現象を重回帰分析するために考えだされた方法です.世界恐慌直後の米国である疫学調査が行われ,その際に考案された手法だとされています.


 確率 p は 0 から 1 の範囲でしか値を取りません.これをマイナス無限大からプラス無限大の範囲に拡張するのがロジットです.グラフを見たほうが分かりやすいでしょう.

 確率pは 0 以上 1 以下の実数です.横軸を p, 縦軸を \displaystyle \frac{p}{1-p} にグラフを描くと下図のようになります.縦軸のオッズの範囲が 0 以上プラス無限大に拡張しました.

Fig1. probability and logit

 次に横軸にオッズ,縦軸に対数オッズ(ロジット)を取ってグラフを描くと下図のようになります.対数オッズ(ロジット)の範囲がマイナス無限大からプラス無限大に拡張しました.

Fig2. logit and logarithm of logit

 最後に横軸にp, 縦軸に対数オッズ(ロジット)を取ってグラフを描くと下図のようになります.0 から 1 の範囲しか取れなかった確率 p が,対数オッズ(ロジット)に変換されることでマイナス無限大からプラス無限大までの実数に拡張したことが分かります.

Fig3. probability and logarithm of logit