In logistic regression analysis, probability is converted to odds, p/(1-p), and odds is converted to logarithm. Binomial distribution, either event of interest happens or doesn’t happen, is analysed by multiple regression analysis.
Probability is between 0 and 1. Logarithm of odds (logit) diverges from minus infinity to plus infinity. See charts to understand.
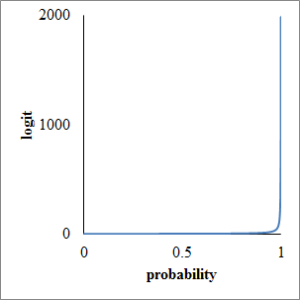
Probability is real between 0 and 1. Take probability horizontal axis and odds vertical axis, respectively. Vertical axis ranges from 0 to infinity, as following chart.

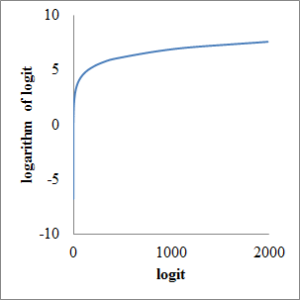
Next, take odds horizontal axis and logarithm of odds vertical axis, respectively. Vertical axis ranges from minus infinity to plus infinity as following chart.

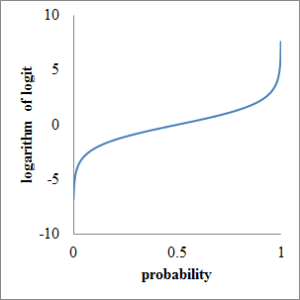
At last, take probability horizontal axis and logit vertical axis, respectively. Although probability ranges only from 0 to 1, logit diverges all real number as following chart.

