多変量解析における変数間の多重共線性を variance inflation factor (VIF) で検証する

 多重共線性は変数間に相関がある場合や線形関係が成立している時に発生し,多変量解析において回帰式が不安定になるなどの様々な問題を引き起こします.その指標の一つとして variance inflation factor (VIF) があり,その値が 10 以上になると多重共線性の影響が強くなるため,その変数は除去して解析すべきです.

  • 少数のデータを追加・削除しただけで回帰式が大きく変化する
  • 異なるデータに適用すると回帰式が大きく変化する
  • 回帰係数の符号がその分野の常識と逆になる
  • 回帰式の寄与率が高くモデルの適合度も良好であるが,ここの回帰係数が有意にならない
  • 回帰式が求まらない

 上記の現象が起きた際には多重共線性の存在を疑います.SPSS では通常の線形回帰分析で統計量オプションから共線性の診断をチェックして VIF を求めることができますが,表計算ソフトでも求めることができます.一つの変数を目的変数とし,他の全ての変数を説明変数として回帰分析を実行し,求まった重相関係数 R2 を用いて下式で求めます.

\displaystyle VIF = \frac{1}{1 - R^2}

VIF measures the impact of multicollinearity among the X’s in a regression model on the precision of estimation. It expresses the degree to which multicollinearity amongst the predictors degrades the precision of an estimate. VIF is a statistic used to measure possible multicollinearity amongst the predictor or explanatory variables. VIF is computed as (1/(1-R2)) for each of the k – 1 independent variable equations. For example, given 4 independent predictor variables, the independent regression equations are formed by using each k-1 independent variable as the dependent variable:
X1 = X2 X3 X4
X2 = X1 X3 X4
X3 = X1 X2 X4
Each independent variable model will return an R2 value and VIF value. The term to exclude in the model is then based on the value of VIF. If Xj is highly correlated with the remaining predictors, its variance inflation factor will be very large. A general rule is that the VIF should not exceed 10 (Belsley, Kuh, & Welsch, 1980). When Xj is orthogonal to the remaining predictors, its variance inflation factor will be 1.

Clearly the shortcomings just mentioned in regard to the use of R as a diagnostic measure for collinearity would seem also to limit the usefulness of R-1 , and this is the case. The prevalence of this measure, however, justifies its separate treatment. Recalling that we are currently assuming the X data to be centered and scaled for unit length, we are considering R-1 = (XTX)-1. The diagonal elements of R-1, the rii, are often called the variance inflation factors, VIFi, [Chatterjee and Price (1077)], and their diagnostic value follows from the relation
\displaystyle VIF_i = \frac{1}{1-R^2_i}
where Ri2 is the multiple correlation coefficient of Xi regressed on the remaining explanatory variables. Clearly a high VIF indicates an Ri2 near unity, and hence points to collinearity. This measure is therefore of some use as an overall indication of collinearity. Its weakness, like those of R, lie in its inability to distinguish among several coexisting near dependencies and in the lack of a meaningful boundary to distinguish between values of VIF that can be considered high and those that can be considered low. [Belsley]

参照:
Cecil Robinson and Randall E. Schumacker: Interaction Effects: Centering, Variance Inflation Factor, and Interpretation Issues. Multiple Linear Regression Viewpoints, 2009, Vol. 35(1)
Belsley, D. A.: Demeaning conditioning diagnostics through centering: The American Statistics 1984; 38: 73 – 82

How to calculate Harrell’s c-index to evaluate multivariate model with EXCEL VBA?

You may use Akaike information criterion (AIC) to evaluate fitting of multivariate model. You could use c-index that Harrell have proposed. Although it seems to evaluate fitting of present data set, it seems not to consider about future data set, it might result in overfitting to present data set.

  1. Make pair from data set with proportional hazard analysis
  2. Calculate risk score
  3. Compare risk score and survival time between pairs
  4. Calculate c-index

1. Make pair from data set with proportional hazard analysis

It’s assumed that sample size is N, the number of pairs could be calculated following formula.

\displaystyle _{N}C_{2} = \frac{N!}{(N-2)!2!}

It’s assumed that worksheet’s structure follows the list below.

  • The 1st line is title.
  • The 1st column is survival time, the 2nd is outcome, the 3rd is a risk score of model 1, the 4th is a risk score of model 2 and the 5th is a risk score of model 3, respectively.
  • All data type is numerical.
  • In outcome, 0 is death and 1 is censored, respectively.
Option Explicit

Sub C_Statistics()
    Dim i   As Long
    Dim j   As Long
    Dim k   As Long
    Dim Rng As Range
    Dim Ar  As Variant
    k = 0
    Set Rng = ActiveSheet.UsedRange
    Set Rng = Rng.Resize(Rng.Rows.Count - 1).Offset(1)
    Ar = Rng
    For i = LBound(Ar) To UBound(Ar) - 1
        For j = i + 1 To UBound(Ar)
            k = k + 1
        Next j
    Next i
    Debug.Print "k= " & k
End Sub

2. Calculate risk score

Risk score (R) is calculated as following formula.

\displaystyle R = \beta_1 X_1 + \beta_2 X_2 + \cdots + \beta_n X_n

\displaystyle S(t, X) = S_0(t)^{\exp(R-R_0)}

A point estimated of effect size in COX proportional hazard analysis is hazard ratio (Exp(Β)) and regression coefficient of covariate is logarithm of hazard ratio (Β). It’s assumed that risk score has been calculated.

3. Compare risk score and survival time between both of pair

It’s important that “If both of pair was censored or one of pair was censored and survival time of censored is short, they were classified as unknown”. In other words,

  • Accept the pair both of it is death
  • If one of pair is death and the survival time of death is shorter than the censored, accept it.

It’s as following VBA code. It’s assumed that it doesn’t includes equal sign if both survival time of pair were equal.

            Select Case Ar(i, 2) + Ar(j, 2)
            Case 0
                k = k + 1
            Case 1
                If (Ar(i, 1) - Ar(j, 1)) * (Ar(i, 2) - Ar(j, 2)) > 0 Then
                    k = k + 1
                End If
            End Select

Furthermore, you would compare risk score and survival time between both of pair and evaluate the sign of product of the differentiation of risk score and the differentiation of survival time, respectively. It means that whether the magnitude of risk score and the length of survival time are consistent or not. It’s assumed that lower risk score means longer survival time.

Option Explicit

Sub C_Statistics()
    Dim i   As Long
    Dim j   As Long
    Dim k   As Long
    Dim n1  As Long
    Dim n2  As Long
    Dim n3  As Long
    Dim Rng As Range
    Dim Ar  As Variant
    
    k = 0
    n1 = 0
    n2 = 0
    n3 = 0
    Set Rng = ActiveSheet.UsedRange
    Set Rng = Rng.Resize(Rng.Rows.Count - 1).Offset(1)
    Ar = Rng
    For i = LBound(Ar) To UBound(Ar) - 1
        For j = i + 1 To UBound(Ar)
            Select Case Ar(i, 2) + Ar(j, 2)
            Case 0
                If (Ar(i, 1) - Ar(j, 1)) * (Ar(i, 3) - Ar(j, 3)) < 0 Then
                    n1 = n1 + 1
                End If
                If (Ar(i, 1) - Ar(j, 1)) * (Ar(i, 4) - Ar(j, 4)) < 0 Then
                    n2 = n2 + 1
                End If
                If (Ar(i, 1) - Ar(j, 1)) * (Ar(i, 5) - Ar(j, 5)) < 0 Then
                    n3 = n3 + 1
                End If
                k = k + 1
            Case 1
                If (Ar(i, 1) - Ar(j, 1)) * (Ar(i, 2) - Ar(j, 2)) > 0 Then
                    If (Ar(i, 1) - Ar(j, 1)) * (Ar(i, 3) - Ar(j, 3)) < 0 Then
                        n1 = n1 + 1
                    End If
                    If (Ar(i, 1) - Ar(j, 1)) * (Ar(i, 4) - Ar(j, 4)) < 0 Then
                        n2 = n2 + 1
                    End If
                    If (Ar(i, 1) - Ar(j, 1)) * (Ar(i, 5) - Ar(j, 5)) < 0 Then
                        n3 = n3 + 1
                    End If
                    k = k + 1
                End If
            End Select
        Next j
    Next i
    Debug.Print "n1= " & n1, "n2= " & n2, "n3= " & n3, "k= " & k
    Debug.Print "C1= " & n1 / k, "C2= " & n2 / k, "C3= " & n3 / k
End Sub

The sign of 35th line is larger than 0, it's assumed that censor is 1 and death is 0, would be reversed if censor was 0 and death was 1. The signs of 24th, 27th, 30th, 36th, 39th and 42nd would be reversed if it was assumed that higher risk score means longer survival time.

4. Calculate c-index

n1/k, n2/k and n3/k are c-index of model 1, model 2 and model 3, respectively. c-index ranges between 0 and 1. If c-index is 0.5, it means that the model doesn't fit at all. If it's closer to 0 or 1, it means that the model fits better.

Draw a pair of patients and determine which patient lived longer from his baseline evaluation. Survival times can be validly compared either when both patients have died, or when one has died and the other's followup time has exceeded the survival time of the first. If both patients are still alive, which will live longer is not known, and that pair of patients is not used in the analysis. Otherwise, it can be determined whether the patient with the higher prognostic score (ie, the weighted combination of baseline and test variables used to predict survival) also had the longer survival time. The process is repeated until all possible pairs of patients have been examined. Of the pairs of patients for which the ordering of survival time s could be inferred, the fraction of pairs such that the patient with the higher score had the longer survival time will be denoted by c.

The index c estimates the probability that, of two randomly chosen patients, the patient with the higher prognostic score will outlive the patient with the lower prognostic score. Values of c near .5 indicate that the prognostic score is no better than a coin-flip in determining which patient will live longer. Values of c near 0 or 1 indicate the baseline data virtually always determine which patient has a better prognosis. The c index measures a probability; many clinicians are more used to dealing with a correlation index that ranges from -1 to +1. A Kendall or Goodman-Kruskal type of correlation index can easily be constructed by calculating γ = 2(c - .5), where γ is the estimated probability that the prognostic score correctly orders prognosis for a pair of patients minus the probability that it incorrectly orders prognosis. When the prognostic score is unrelated to survival time, gamma is zero. When gamma = .5, the relationship between the prognostic score and survival time is halfway between a random relationship and a perfect relationship, and the corresponding c value is .75.

References:
Frank E. Harrell Jr, et al: Evaluating the Yield of Medical Tests. JAMA. 1982; 247 (18): 2543 - 2546
Morizane Toshio: Multivariate model, International Medical Information Center 2008; 29 (3): 8 - 12

多変量モデル評価法のc-indexをEXCEL VBAで計算する

 多変量モデルの適合度の評価方法には通常赤池情報量基準 (AIC) を用いますが,Harrell らの提唱する c-index という指標もあります.c 統計値とも言い,リスクスコアの小さい(又は大きい)症例の方が生存期間が長いことが実際のデータでどれくらいの確率で正しいかを示す値です.方法は後述しますが,AIC と比較すると現在のデータに対する適合度のみを評価しており,未来のデータの予測精度への考慮がないように思えます.その意味で overfitting の可能性がある評価法と言えなくもありません.

  1. 比例ハザード解析対象となった症例から,全てのペアを作る
  2. それらのリスクスコアを調べる
  3. リスクスコアの大小および生存期間の長短を比較する
  4. c-index を計算する

1. 比例ハザード解析対象となった症例から,全てのペア(2症例ずつの組み合わせ)を作る

 サンプルサイズを N とすると,全てのペア数は下式で表現されます.

\displaystyle _{N}C_{2} = \frac{N!}{(N-2)!2!}

 ワークシート上にデータがあるとして,1行が1症例とすると,全ての行から任意の2行を取り出すコードは下記のようになります.ワークシートの構造が以下のようであると仮定します.

  • 1 行目はタイトル行である.
  • A 列は生存期間, B 列は転帰,C 列はモデル 1 のリスクスコア,D 列はモデル 2 のリスクスコア,E 列はモデル 3 のリスクスコアをそれぞれ表現する.
  • 全てのデータは数値型である.
  • B 列で死亡は 0, 打切は 1 と表現する.
Option Explicit

Sub C_Statistics()
    Dim i   As Long
    Dim j   As Long
    Dim k   As Long
    Dim Rng As Range
    Dim Ar  As Variant
    k = 0
    Set Rng = ActiveSheet.UsedRange
    Set Rng = Rng.Resize(Rng.Rows.Count - 1).Offset(1)
    Ar = Rng
    For i = LBound(Ar) To UBound(Ar) - 1
        For j = i + 1 To UBound(Ar)
            k = k + 1
        Next j
    Next i
    Debug.Print "k= " & k
End Sub

2. それらのリスクスコアを調べる

 リスクスコア (R) は下式で表現されます.予後を規定するという意味で予後スコア prognostic score とも言います.β は回帰係数,X は共変量です.R0 は全症例のリスクスコアの平均値です.S0(t) はベースラインの生存率であり,全ての説明変数が基準値である場合の各時点 t での生存率です.

\displaystyle R = \beta_1 X_1 + \beta_2 X_2 + \cdots + \beta_n X_n

\displaystyle S(t, X) = S_0(t)^{\exp(R-R_0)}

 COX 比例ハザード分析では効果量の点推定値はハザード比 (Exp(Β)) として表現され,共変量の回帰係数はハザード比の対数 (LN(Exp(Β)) = Β) として表現します.それぞれの共変量にそれぞれの回帰係数をかけた積の和がリスクスコアです.ここでは既にリスクスコアの計算は終わっているものとします.

3. リスクスコアの大小および生存期間の長短を比較する

 ここで重要な点は「2 症例とも打切例,あるいは片方が打切で打切までの期間がより短い場合は不明に分類される」との記述を条件式に表現する方法です.この条件は次のように言い換えることができます.

  • 両者とも死亡のペアを受け入れる
  • 一方が死亡の場合,死亡例の生存期間が打切例の生存期間より短いなら受け入れる

 これを VBA で表現すると以下のようになります.2 行目と 4 行目の Case 式はそれぞれ上述した条件式に該当します.5 行目は上述の条件の後者を表現したものであり,生存期間の差と転帰の差との積を取り,符号が負の場合は拒否します.参照書籍の記述によると『打切例の打切までの生存期間が同じ値かあるいは短い場合にはどちらの生存が長いかは判断することができない』とのことですので,等号は外すこととします.

            Select Case Ar(i, 2) + Ar(j, 2)
            Case 0
                k = k + 1
            Case 1
                If (Ar(i, 1) - Ar(j, 1)) * (Ar(i, 2) - Ar(j, 2)) > 0 Then
                    k = k + 1
                End If
            End Select

 さらにリスクスコアと生存期間とを比較します.同様にリスクスコアの差と生存期間の差との積の符号を評価します.リスクスコアの大小と生存期間の長短とが一致しているか否かを,差の積の符号に置き換えている訳です.最初に『リスクスコアの小さい(又は大きい)症例の方が生存期間が長いこと』と述べましたが,説明変数の設定によって各変数の係数の正負を逆転させ,リスクスコアの大小を逆転させることも可能です.ここではリスクスコアが小さいほど生存期間が長いという前提で話を進めます.

Option Explicit

Sub C_Statistics()
    Dim i   As Long
    Dim j   As Long
    Dim k   As Long
    Dim n1  As Long
    Dim n2  As Long
    Dim n3  As Long
    Dim Rng As Range
    Dim Ar  As Variant
    
    k = 0
    n1 = 0
    n2 = 0
    n3 = 0
    Set Rng = ActiveSheet.UsedRange
    Set Rng = Rng.Resize(Rng.Rows.Count - 1).Offset(1)
    Ar = Rng
    For i = LBound(Ar) To UBound(Ar) - 1
        For j = i + 1 To UBound(Ar)
            Select Case Ar(i, 2) + Ar(j, 2)
            Case 0
                If (Ar(i, 1) - Ar(j, 1)) * (Ar(i, 3) - Ar(j, 3)) < 0 Then
                    n1 = n1 + 1
                End If
                If (Ar(i, 1) - Ar(j, 1)) * (Ar(i, 4) - Ar(j, 4)) < 0 Then
                    n2 = n2 + 1
                End If
                If (Ar(i, 1) - Ar(j, 1)) * (Ar(i, 5) - Ar(j, 5)) < 0 Then
                    n3 = n3 + 1
                End If
                k = k + 1
            Case 1
                If (Ar(i, 1) - Ar(j, 1)) * (Ar(i, 2) - Ar(j, 2)) > 0 Then
                    If (Ar(i, 1) - Ar(j, 1)) * (Ar(i, 3) - Ar(j, 3)) < 0 Then
                        n1 = n1 + 1
                    End If
                    If (Ar(i, 1) - Ar(j, 1)) * (Ar(i, 4) - Ar(j, 4)) < 0 Then
                        n2 = n2 + 1
                    End If
                    If (Ar(i, 1) - Ar(j, 1)) * (Ar(i, 5) - Ar(j, 5)) < 0 Then
                        n3 = n3 + 1
                    End If
                    k = k + 1
                End If
            End Select
        Next j
    Next i
    Debug.Print "n1= " & n1, "n2= " & n2, "n3= " & n3, "k= " & k
    Debug.Print "C1= " & n1 / k, "C2= " & n2 / k, "C3= " & n3 / k
End Sub

 35 行目の条件式の符号は打切が 1, 死亡が 0 の際のものです.打切が 0, 死亡が 1 なら符号は逆転します.同様にリスクスコアが大きいほど生存期間が長いなら 24, 27, 30, 36, 39, 42 行目の符号は逆転します.

4. c-index を計算する

 リスクスコアと生存の関係が (1) 一致しているか,(2) 一致していないか,(3) 不明かで結果を場合分けしそれぞれの個数をカウントします.(1)/((1)+(2)) の比率が c-index です.上記では n1/k, n2/k, n3/k がそれぞれのモデルの c-index となります.c-index は 0 から 1 までの値を取りますが,0.5 の場合は全く適合していないと評価します.0 または 1 に近いほど適合が良いと評価します.

Draw a pair of patients and determine which patient lived longer from his baseline evaluation. Survival times can be validly compared either when both patients have died, or when one has died and the other's followup time has exceeded the survival time of the first. If both patients are still alive, which will live longer is not known, and that pair of patients is not used in the analysis. Otherwise, it can be determined whether the patient with the higher prognostic score (ie, the weighted combination of baseline and test variables used to predict survival) also had the longer survival time. The process is repeated until all possible pairs of patients have been examined. Of the pairs of patients for which the ordering of survival time s could be inferred, the fraction of pairs such that the patient with the higher score had the longer survival time will be denoted by c.

The index c estimates the probability that, of two randomly chosen patients, the patient with the higher prognostic score will outlive the patient with the lower prognostic score. Values of c near .5 indicate that the prognostic score is no better than a coin-flip in determining which patient will live longer. Values of c near 0 or 1 indicate the baseline data virtually always determine which patient has a better prognosis. The c index measures a probability; many clinicians are more used to dealing with a correlation index that ranges from -1 to +1. A Kendall or Goodman-Kruskal type of correlation index can easily be constructed by calculating γ = 2(c - .5), where γ is the estimated probability that the prognostic score correctly orders prognosis for a pair of patients minus the probability that it incorrectly orders prognosis. When the prognostic score is unrelated to survival time, gamma is zero. When gamma = .5, the relationship between the prognostic score and survival time is halfway between a random relationship and a perfect relationship, and the corresponding c value is .75.

参照:
Frank E. Harrell Jr, et al: Evaluating the Yield of Medical Tests. JAMA. 1982; 247 (18): 2543 - 2546
森實敏夫:多変量モデル,あいみっく,2008; 29 (3): 8 - 12(国際医学情報センター)

Properties of Revision of Microsoft Word 2010

It’s important for research members who had posted papers to compare between first edition and final version of them. I had investigated properties of revision in Microsoft Word 2010 VBA.

Revision

Option Explicit

Sub Revision()
    Dim myDoc   As Document
    Set myDoc = ActiveDocument
    With myDoc
        .TrackRevisions = True
        .TrackMoves = True
        .TrackFormatting = True
    End With
    With Options
        
        .InsertedTextMark = wdInsertedTextMarkBold
        .InsertedTextMark = wdInsertedTextMarkColorOnly
        .InsertedTextMark = wdInsertedTextMarkDoubleStrikeThrough
        .InsertedTextMark = wdInsertedTextMarkDoubleUnderline
        .InsertedTextMark = wdInsertedTextMarkItalic
        .InsertedTextMark = wdInsertedTextMarkNone
        .InsertedTextMark = wdInsertedTextMarkStrikeThrough
        .InsertedTextMark = wdInsertedTextMarkUnderline
        
        .InsertedTextColor = wdAuto
        .InsertedTextColor = wdBlack
        .InsertedTextColor = wdBlue
        .InsertedTextColor = wdBrightGreen
        .InsertedTextColor = wdByAuthor
        .InsertedTextColor = wdDarkBlue
        .InsertedTextColor = wdDarkRed
        .InsertedTextColor = wdDarkYellow
        .InsertedTextColor = wdGray25
        .InsertedTextColor = wdGray50
        .InsertedTextColor = wdGreen
        .InsertedTextColor = wdNoHighlight
        .InsertedTextColor = wdPink
        .InsertedTextColor = wdRed
        .InsertedTextColor = wdTeal
        .InsertedTextColor = wdTurquoise
        .InsertedTextColor = wdViolet
        .InsertedTextColor = wdWhite
        .InsertedTextColor = wdYellow
        
        .DeletedTextMark = wdDeletedTextMarkBold
        .DeletedTextMark = wdDeletedTextMarkCaret
        .DeletedTextMark = wdDeletedTextMarkColorOnly
        .DeletedTextMark = wdDeletedTextMarkDoubleStrikeThrough
        .DeletedTextMark = wdDeletedTextMarkDoubleUnderline
        .DeletedTextMark = wdDeletedTextMarkHidden
        .DeletedTextMark = wdDeletedTextMarkItalic
        .DeletedTextMark = wdDeletedTextMarkNone
        .DeletedTextMark = wdDeletedTextMarkPound
        .DeletedTextMark = wdDeletedTextMarkStrikeThrough
        .DeletedTextMark = wdDeletedTextMarkUnderline
        
        .DeletedTextColor = wdAuto
        .DeletedTextColor = wdBlack
        .DeletedTextColor = wdBlue
        .DeletedTextColor = wdBrightGreen
        .DeletedTextColor = wdByAuthor
        .DeletedTextColor = wdDarkBlue
        .DeletedTextColor = wdDarkRed
        .DeletedTextColor = wdDarkYellow
        .DeletedTextColor = wdGray25
        .DeletedTextColor = wdGray50
        .DeletedTextColor = wdGreen
        .DeletedTextColor = wdNoHighlight
        .DeletedTextColor = wdPink
        .DeletedTextColor = wdRed
        .DeletedTextColor = wdTeal
        .DeletedTextColor = wdTurquoise
        .DeletedTextColor = wdViolet
        .DeletedTextColor = wdWhite
        .DeletedTextColor = wdYellow
        
        .RevisedLinesMark = wdRevisedLinesMarkLeftBorder
        .RevisedLinesMark = wdRevisedLinesMarkNone
        .RevisedLinesMark = wdRevisedLinesMarkOutsideBorder
        .RevisedLinesMark = wdRevisedLinesMarkRightBorder
        
        .RevisedLinesColor = wdAuto
        .RevisedLinesColor = wdBlack
        .RevisedLinesColor = wdBlue
        .RevisedLinesColor = wdBrightGreen
        .RevisedLinesColor = wdByAuthor
        .RevisedLinesColor = wdDarkBlue
        .RevisedLinesColor = wdDarkRed
        .RevisedLinesColor = wdDarkYellow
        .RevisedLinesColor = wdGray25
        .RevisedLinesColor = wdGray50
        .RevisedLinesColor = wdGreen
        .RevisedLinesColor = wdNoHighlight
        .RevisedLinesColor = wdPink
        .RevisedLinesColor = wdRed
        .RevisedLinesColor = wdTeal
        .RevisedLinesColor = wdTurquoise
        .RevisedLinesColor = wdViolet
        .RevisedLinesColor = wdWhite
        .RevisedLinesColor = wdYellow
        
        .CommentsColor = wdAuto
        .CommentsColor = wdBlack
        .CommentsColor = wdBlue
        .CommentsColor = wdBrightGreen
        .CommentsColor = wdByAuthor
        .CommentsColor = wdDarkBlue
        .CommentsColor = wdDarkRed
        .CommentsColor = wdDarkYellow
        .CommentsColor = wdGray25
        .CommentsColor = wdGray50
        .CommentsColor = wdGreen
        .CommentsColor = wdNoHighlight
        .CommentsColor = wdPink
        .CommentsColor = wdRed
        .CommentsColor = wdTeal
        .CommentsColor = wdTurquoise
        .CommentsColor = wdViolet
        .CommentsColor = wdWhite
        .CommentsColor = wdYellow
        
        .MoveFromTextMark = wdMoveFromTextMarkBold
        .MoveFromTextMark = wdMoveFromTextMarkCaret
        .MoveFromTextMark = wdMoveFromTextMarkColorOnly
        .MoveFromTextMark = wdMoveFromTextMarkDoubleStrikeThrough
        .MoveFromTextMark = wdMoveFromTextMarkDoubleUnderline
        .MoveFromTextMark = wdMoveFromTextMarkHidden
        .MoveFromTextMark = wdMoveFromTextMarkItalic
        .MoveFromTextMark = wdMoveFromTextMarkNone
        .MoveFromTextMark = wdMoveFromTextMarkPound
        .MoveFromTextMark = wdMoveFromTextMarkStrikeThrough
        .MoveFromTextMark = wdMoveFromTextMarkUnderline
        
        .MoveFromTextColor = wdAuto
        .MoveFromTextColor = wdBlack
        .MoveFromTextColor = wdBlue
        .MoveFromTextColor = wdBrightGreen
        .MoveFromTextColor = wdByAuthor
        .MoveFromTextColor = wdDarkBlue
        .MoveFromTextColor = wdDarkRed
        .MoveFromTextColor = wdDarkYellow
        .MoveFromTextColor = wdGray25
        .MoveFromTextColor = wdGray50
        .MoveFromTextColor = wdGreen
        .MoveFromTextColor = wdNoHighlight
        .MoveFromTextColor = wdPink
        .MoveFromTextColor = wdRed
        .MoveFromTextColor = wdTeal
        .MoveFromTextColor = wdTurquoise
        .MoveFromTextColor = wdViolet
        .MoveFromTextColor = wdWhite
        .MoveFromTextColor = wdYellow
        
        .MoveToTextMark = wdMoveToTextMarkBold
        .MoveToTextMark = wdMoveToTextMarkColorOnly
        .MoveToTextMark = wdMoveToTextMarkDoubleStrikeThrough
        .MoveToTextMark = wdMoveToTextMarkDoubleUnderline
        .MoveToTextMark = wdMoveToTextMarkItalic
        .MoveToTextMark = wdMoveToTextMarkNone
        .MoveToTextMark = wdMoveToTextMarkStrikeThrough
        .MoveToTextMark = wdMoveToTextMarkUnderline
        
        .MoveToTextColor = wdAuto
        .MoveToTextColor = wdBlack
        .MoveToTextColor = wdBlue
        .MoveToTextColor = wdBrightGreen
        .MoveToTextColor = wdByAuthor
        .MoveToTextColor = wdDarkBlue
        .MoveToTextColor = wdDarkRed
        .MoveToTextColor = wdDarkYellow
        .MoveToTextColor = wdGray25
        .MoveToTextColor = wdGray50
        .MoveToTextColor = wdGreen
        .MoveToTextColor = wdNoHighlight
        .MoveToTextColor = wdPink
        .MoveToTextColor = wdRed
        .MoveToTextColor = wdTeal
        .MoveToTextColor = wdTurquoise
        .MoveToTextColor = wdViolet
        .MoveToTextColor = wdWhite
        .MoveToTextColor = wdYellow
        
        .InsertedCellColor = wdCellColorByAuthor
        .InsertedCellColor = wdCellColorLightBlue
        .InsertedCellColor = wdCellColorLightGray
        .InsertedCellColor = wdCellColorLightGreen
        .InsertedCellColor = wdCellColorLightOrange
        .InsertedCellColor = wdCellColorLightPurple
        .InsertedCellColor = wdCellColorLightYellow
        .InsertedCellColor = wdCellColorNoHighlight
        .InsertedCellColor = wdCellColorPink
        
        .MergedCellColor = wdCellColorByAuthor
        .MergedCellColor = wdCellColorLightBlue
        .MergedCellColor = wdCellColorLightGray
        .MergedCellColor = wdCellColorLightGreen
        .MergedCellColor = wdCellColorLightOrange
        .MergedCellColor = wdCellColorLightPurple
        .MergedCellColor = wdCellColorLightYellow
        .MergedCellColor = wdCellColorNoHighlight
        .MergedCellColor = wdCellColorPink
        
        .DeletedCellColor = wdCellColorByAuthor
        .DeletedCellColor = wdCellColorLightBlue
        .DeletedCellColor = wdCellColorLightGray
        .DeletedCellColor = wdCellColorLightGreen
        .DeletedCellColor = wdCellColorLightOrange
        .DeletedCellColor = wdCellColorLightPurple
        .DeletedCellColor = wdCellColorLightYellow
        .DeletedCellColor = wdCellColorNoHighlight
        .DeletedCellColor = wdCellColorPink
        
        .SplitCellColor = wdCellColorByAuthor
        .SplitCellColor = wdCellColorLightBlue
        .SplitCellColor = wdCellColorLightGray
        .SplitCellColor = wdCellColorLightGreen
        .SplitCellColor = wdCellColorLightOrange
        .SplitCellColor = wdCellColorLightPurple
        .SplitCellColor = wdCellColorLightYellow
        .SplitCellColor = wdCellColorNoHighlight
        .SplitCellColor = wdCellColorPink
        
        .RevisedPropertiesMark = wdRevisedPropertiesMarkBold
        .RevisedPropertiesMark = wdRevisedPropertiesMarkColorOnly
        .RevisedPropertiesMark = wdRevisedPropertiesMarkDoubleStrikeThrough
        .RevisedPropertiesMark = wdRevisedPropertiesMarkDoubleUnderline
        .RevisedPropertiesMark = wdRevisedPropertiesMarkItalic
        .RevisedPropertiesMark = wdRevisedPropertiesMarkNone
        .RevisedPropertiesMark = wdRevisedPropertiesMarkStrikeThrough
        .RevisedPropertiesMark = wdRevisedPropertiesMarkUnderline
        
        .RevisedPropertiesColor = wdAuto
        .RevisedPropertiesColor = wdBlack
        .RevisedPropertiesColor = wdBlue
        .RevisedPropertiesColor = wdBrightGreen
        .RevisedPropertiesColor = wdByAuthor
        .RevisedPropertiesColor = wdDarkBlue
        .RevisedPropertiesColor = wdDarkRed
        .RevisedPropertiesColor = wdDarkYellow
        .RevisedPropertiesColor = wdGray25
        .RevisedPropertiesColor = wdGray50
        .RevisedPropertiesColor = wdGreen
        .RevisedPropertiesColor = wdNoHighlight
        .RevisedPropertiesColor = wdPink
        .RevisedPropertiesColor = wdRed
        .RevisedPropertiesColor = wdTeal
        .RevisedPropertiesColor = wdTurquoise
        .RevisedPropertiesColor = wdViolet
        .RevisedPropertiesColor = wdWhite
        .RevisedPropertiesColor = wdYellow
        
        .RevisionsBalloonPrintOrientation = wdBalloonPrintOrientationAuto
        .RevisionsBalloonPrintOrientation = wdBalloonPrintOrientationForceLandscape
        .RevisionsBalloonPrintOrientation = wdBalloonPrintOrientationPreserve
    End With
    
    With ActiveWindow.View
        
        .RevisionsMode = wdBalloonRevisions
        .RevisionsMode = wdInLineRevisions
        .RevisionsMode = wdMixedRevisions
        
        .RevisionsBalloonShowConnectingLines = False
        .RevisionsBalloonShowConnectingLines = True
        
        .RevisionsBalloonSide = wdLeftMargin
        .RevisionsBalloonSide = wdRightMargin
        
        .RevisionsBalloonWidthType = wdBalloonWidthPoints
        .RevisionsBalloonWidthType = wdBalloonWidthPercent
        
        .RevisionsBalloonWidth = MillimetersToPoints(76.2)
        .RevisionsBalloonWidth = 36
    End With
End Sub

Microsoft Word 2010のドキュメントの変更履歴のプロパティ

 研究者にとって論文の初版からの変更履歴を記録しておくと最終版との比較に便利です.Word VBA でそのプロパティを調べてみました.

Revision

Option Explicit

Sub Revision()
    Dim myDoc   As Document
    Set myDoc = ActiveDocument
    With myDoc
        .TrackRevisions = True  '変更履歴開始
        .TrackMoves = True      '移動を記録する
        .TrackFormatting = True '書式の変更を記録する
    End With
    With Options
        '挿入された箇所'
        .InsertedTextMark = wdInsertedTextMarkBold
        .InsertedTextMark = wdInsertedTextMarkColorOnly
        .InsertedTextMark = wdInsertedTextMarkDoubleStrikeThrough
        .InsertedTextMark = wdInsertedTextMarkDoubleUnderline
        .InsertedTextMark = wdInsertedTextMarkItalic
        .InsertedTextMark = wdInsertedTextMarkNone
        .InsertedTextMark = wdInsertedTextMarkStrikeThrough
        .InsertedTextMark = wdInsertedTextMarkUnderline
        '(挿入された箇所の)色'
        .InsertedTextColor = wdAuto         '自動'
        .InsertedTextColor = wdBlack        '黒'
        .InsertedTextColor = wdBlue         '青'
        .InsertedTextColor = wdBrightGreen  '明るい緑'
        .InsertedTextColor = wdByAuthor     '校閲者別'
        .InsertedTextColor = wdDarkBlue     '濃い青'
        .InsertedTextColor = wdDarkRed      '濃い赤'
        .InsertedTextColor = wdDarkYellow   '濃い黄'
        .InsertedTextColor = wdGray25       '25% 灰色'
        .InsertedTextColor = wdGray50       '50% 灰色'
        .InsertedTextColor = wdGreen        '緑'
        .InsertedTextColor = wdNoHighlight  '(なし)'
        .InsertedTextColor = wdPink         'ピンク'
        .InsertedTextColor = wdRed          '赤'
        .InsertedTextColor = wdTeal         '青緑'
        .InsertedTextColor = wdTurquoise    '水色'
        .InsertedTextColor = wdViolet       '紫'
        .InsertedTextColor = wdWhite        '白'
        .InsertedTextColor = wdYellow       '黄'
        '削除された箇所'
        .DeletedTextMark = wdDeletedTextMarkBold                '太字'
        .DeletedTextMark = wdDeletedTextMarkCaret               '^(キャレット)'
        .DeletedTextMark = wdDeletedTextMarkColorOnly           '色のみ'
        .DeletedTextMark = wdDeletedTextMarkDoubleStrikeThrough '二重取り消し線'
        .DeletedTextMark = wdDeletedTextMarkDoubleUnderline     '二重下線'
        .DeletedTextMark = wdDeletedTextMarkHidden              '隠し文字'
        .DeletedTextMark = wdDeletedTextMarkItalic              '斜体'
        .DeletedTextMark = wdDeletedTextMarkNone                '(なし)'
        .DeletedTextMark = wdDeletedTextMarkPound               '#(パウンド)'
        .DeletedTextMark = wdDeletedTextMarkStrikeThrough       '取り消し線'
        .DeletedTextMark = wdDeletedTextMarkUnderline           '下線'
        '(削除された箇所の)色'
        .DeletedTextColor = wdAuto
        .DeletedTextColor = wdBlack
        .DeletedTextColor = wdBlue
        .DeletedTextColor = wdBrightGreen
        .DeletedTextColor = wdByAuthor
        .DeletedTextColor = wdDarkBlue
        .DeletedTextColor = wdDarkRed
        .DeletedTextColor = wdDarkYellow
        .DeletedTextColor = wdGray25
        .DeletedTextColor = wdGray50
        .DeletedTextColor = wdGreen
        .DeletedTextColor = wdNoHighlight
        .DeletedTextColor = wdPink
        .DeletedTextColor = wdRed
        .DeletedTextColor = wdTeal
        .DeletedTextColor = wdTurquoise
        .DeletedTextColor = wdViolet
        .DeletedTextColor = wdWhite
        .DeletedTextColor = wdYellow
        '変更された行'
        .RevisedLinesMark = wdRevisedLinesMarkLeftBorder    '左罫線'
        .RevisedLinesMark = wdRevisedLinesMarkNone          '(なし)'
        .RevisedLinesMark = wdRevisedLinesMarkOutsideBorder '外枠'
        .RevisedLinesMark = wdRevisedLinesMarkRightBorder   '右罫線'
        '(変更された行の)色'
        .RevisedLinesColor = wdAuto
        .RevisedLinesColor = wdBlack
        .RevisedLinesColor = wdBlue
        .RevisedLinesColor = wdBrightGreen
        .RevisedLinesColor = wdByAuthor
        .RevisedLinesColor = wdDarkBlue
        .RevisedLinesColor = wdDarkRed
        .RevisedLinesColor = wdDarkYellow
        .RevisedLinesColor = wdGray25
        .RevisedLinesColor = wdGray50
        .RevisedLinesColor = wdGreen
        .RevisedLinesColor = wdNoHighlight
        .RevisedLinesColor = wdPink
        .RevisedLinesColor = wdRed
        .RevisedLinesColor = wdTeal
        .RevisedLinesColor = wdTurquoise
        .RevisedLinesColor = wdViolet
        .RevisedLinesColor = wdWhite
        .RevisedLinesColor = wdYellow
        'コメントの色'
        .CommentsColor = wdAuto
        .CommentsColor = wdBlack
        .CommentsColor = wdBlue
        .CommentsColor = wdBrightGreen
        .CommentsColor = wdByAuthor
        .CommentsColor = wdDarkBlue
        .CommentsColor = wdDarkRed
        .CommentsColor = wdDarkYellow
        .CommentsColor = wdGray25
        .CommentsColor = wdGray50
        .CommentsColor = wdGreen
        .CommentsColor = wdNoHighlight
        .CommentsColor = wdPink
        .CommentsColor = wdRed
        .CommentsColor = wdTeal
        .CommentsColor = wdTurquoise
        .CommentsColor = wdViolet
        .CommentsColor = wdWhite
        .CommentsColor = wdYellow
        '移動前'
        .MoveFromTextMark = wdMoveFromTextMarkBold
        .MoveFromTextMark = wdMoveFromTextMarkCaret
        .MoveFromTextMark = wdMoveFromTextMarkColorOnly
        .MoveFromTextMark = wdMoveFromTextMarkDoubleStrikeThrough
        .MoveFromTextMark = wdMoveFromTextMarkDoubleUnderline
        .MoveFromTextMark = wdMoveFromTextMarkHidden
        .MoveFromTextMark = wdMoveFromTextMarkItalic
        .MoveFromTextMark = wdMoveFromTextMarkNone
        .MoveFromTextMark = wdMoveFromTextMarkPound
        .MoveFromTextMark = wdMoveFromTextMarkStrikeThrough
        .MoveFromTextMark = wdMoveFromTextMarkUnderline
        '(移動前の)色'
        .MoveFromTextColor = wdAuto
        .MoveFromTextColor = wdBlack
        .MoveFromTextColor = wdBlue
        .MoveFromTextColor = wdBrightGreen
        .MoveFromTextColor = wdByAuthor
        .MoveFromTextColor = wdDarkBlue
        .MoveFromTextColor = wdDarkRed
        .MoveFromTextColor = wdDarkYellow
        .MoveFromTextColor = wdGray25
        .MoveFromTextColor = wdGray50
        .MoveFromTextColor = wdGreen
        .MoveFromTextColor = wdNoHighlight
        .MoveFromTextColor = wdPink
        .MoveFromTextColor = wdRed
        .MoveFromTextColor = wdTeal
        .MoveFromTextColor = wdTurquoise
        .MoveFromTextColor = wdViolet
        .MoveFromTextColor = wdWhite
        .MoveFromTextColor = wdYellow
        '移動後'
        .MoveToTextMark = wdMoveToTextMarkBold
        .MoveToTextMark = wdMoveToTextMarkColorOnly
        .MoveToTextMark = wdMoveToTextMarkDoubleStrikeThrough
        .MoveToTextMark = wdMoveToTextMarkDoubleUnderline
        .MoveToTextMark = wdMoveToTextMarkItalic
        .MoveToTextMark = wdMoveToTextMarkNone
        .MoveToTextMark = wdMoveToTextMarkStrikeThrough
        .MoveToTextMark = wdMoveToTextMarkUnderline
        '(移動後の)色'
        .MoveToTextColor = wdAuto
        .MoveToTextColor = wdBlack
        .MoveToTextColor = wdBlue
        .MoveToTextColor = wdBrightGreen
        .MoveToTextColor = wdByAuthor
        .MoveToTextColor = wdDarkBlue
        .MoveToTextColor = wdDarkRed
        .MoveToTextColor = wdDarkYellow
        .MoveToTextColor = wdGray25
        .MoveToTextColor = wdGray50
        .MoveToTextColor = wdGreen
        .MoveToTextColor = wdNoHighlight
        .MoveToTextColor = wdPink
        .MoveToTextColor = wdRed
        .MoveToTextColor = wdTeal
        .MoveToTextColor = wdTurquoise
        .MoveToTextColor = wdViolet
        .MoveToTextColor = wdWhite
        .MoveToTextColor = wdYellow
        '挿入されたセル'
        .InsertedCellColor = wdCellColorByAuthor    '校閲者別'
        .InsertedCellColor = wdCellColorLightBlue   '薄い青'
        .InsertedCellColor = wdCellColorLightGray   '薄い灰色'
        .InsertedCellColor = wdCellColorLightGreen  '薄い緑'
        .InsertedCellColor = wdCellColorLightOrange '薄いオレンジ'
        .InsertedCellColor = wdCellColorLightPurple '薄い紫'
        .InsertedCellColor = wdCellColorLightYellow '薄い黄'
        .InsertedCellColor = wdCellColorNoHighlight '(なし)'
        .InsertedCellColor = wdCellColorPink        '薄いピンク'
        '結合されたセル'
        .MergedCellColor = wdCellColorByAuthor
        .MergedCellColor = wdCellColorLightBlue
        .MergedCellColor = wdCellColorLightGray
        .MergedCellColor = wdCellColorLightGreen
        .MergedCellColor = wdCellColorLightOrange
        .MergedCellColor = wdCellColorLightPurple
        .MergedCellColor = wdCellColorLightYellow
        .MergedCellColor = wdCellColorNoHighlight
        .MergedCellColor = wdCellColorPink
        '削除されたセル'
        .DeletedCellColor = wdCellColorByAuthor
        .DeletedCellColor = wdCellColorLightBlue
        .DeletedCellColor = wdCellColorLightGray
        .DeletedCellColor = wdCellColorLightGreen
        .DeletedCellColor = wdCellColorLightOrange
        .DeletedCellColor = wdCellColorLightPurple
        .DeletedCellColor = wdCellColorLightYellow
        .DeletedCellColor = wdCellColorNoHighlight
        .DeletedCellColor = wdCellColorPink
        '分割されたセル'
        .SplitCellColor = wdCellColorByAuthor
        .SplitCellColor = wdCellColorLightBlue
        .SplitCellColor = wdCellColorLightGray
        .SplitCellColor = wdCellColorLightGreen
        .SplitCellColor = wdCellColorLightOrange
        .SplitCellColor = wdCellColorLightPurple
        .SplitCellColor = wdCellColorLightYellow
        .SplitCellColor = wdCellColorNoHighlight
        .SplitCellColor = wdCellColorPink
        '書式が変更された箇所'
        .RevisedPropertiesMark = wdRevisedPropertiesMarkBold                '太字'
        .RevisedPropertiesMark = wdRevisedPropertiesMarkColorOnly           '色のみ'
        .RevisedPropertiesMark = wdRevisedPropertiesMarkDoubleStrikeThrough '二重取り消し線'
        .RevisedPropertiesMark = wdRevisedPropertiesMarkDoubleUnderline     '二重下線'
        .RevisedPropertiesMark = wdRevisedPropertiesMarkItalic              '斜体'
        .RevisedPropertiesMark = wdRevisedPropertiesMarkNone                '(なし)'
        .RevisedPropertiesMark = wdRevisedPropertiesMarkStrikeThrough       '取り消し線'
        .RevisedPropertiesMark = wdRevisedPropertiesMarkUnderline           '下線'
        '(書式が変更された)色'
        .RevisedPropertiesColor = wdAuto
        .RevisedPropertiesColor = wdBlack
        .RevisedPropertiesColor = wdBlue
        .RevisedPropertiesColor = wdBrightGreen
        .RevisedPropertiesColor = wdByAuthor
        .RevisedPropertiesColor = wdDarkBlue
        .RevisedPropertiesColor = wdDarkRed
        .RevisedPropertiesColor = wdDarkYellow
        .RevisedPropertiesColor = wdGray25
        .RevisedPropertiesColor = wdGray50
        .RevisedPropertiesColor = wdGreen
        .RevisedPropertiesColor = wdNoHighlight
        .RevisedPropertiesColor = wdPink
        .RevisedPropertiesColor = wdRed
        .RevisedPropertiesColor = wdTeal
        .RevisedPropertiesColor = wdTurquoise
        .RevisedPropertiesColor = wdViolet
        .RevisedPropertiesColor = wdWhite
        .RevisedPropertiesColor = wdYellow
        '印刷するときの用紙の向き'
        .RevisionsBalloonPrintOrientation = wdBalloonPrintOrientationAuto           '自動'
        .RevisionsBalloonPrintOrientation = wdBalloonPrintOrientationForceLandscape '常に横向き'
        .RevisionsBalloonPrintOrientation = wdBalloonPrintOrientationPreserve       '変更しない'
    End With
    
    With ActiveWindow.View
        '印刷およびWebレイアウト表示での吹き出しの仕様'
        .RevisionsMode = wdBalloonRevisions     '使用しない'
        .RevisionsMode = wdInLineRevisions      '常に使用する'
        .RevisionsMode = wdMixedRevisions       'コメント/書式にのみ使用'
        '文字列からの引き出し線を表示する'
        .RevisionsBalloonShowConnectingLines = False
        .RevisionsBalloonShowConnectingLines = True
        '余白'
        .RevisionsBalloonSide = wdLeftMargin    '左余白'
        .RevisionsBalloonSide = wdRightMargin   '右余白'
        '基準'
        .RevisionsBalloonWidthType = wdBalloonWidthPoints   'ミリメートル(mm)'
        .RevisionsBalloonWidthType = wdBalloonWidthPercent  'パーセント(%)'
        '吹き出し線の幅'
        .RevisionsBalloonWidth = MillimetersToPoints(76.2)
        .RevisionsBalloonWidth = 36
    End With
End Sub

EXCEL VBAで2つの1次元配列が等しいか調べ,配列の差分を求める

 EXCEL VBA において,2 つの配列が等しいか否か調べたいことはよくあります.更に2つの配列の差分,つまり互いに重複しない要素を取り出したいという需要もあります.今回は配列の差分を求めるコードを紹介します.

 2つの配列が等しいかをまず調べ,等しくない場合に次に一方が他方の真部分集合であるか否かを調べます.最後に配列の差分を求めます.この順になっているのは全く同じ2つの配列の差分は空集合となって解が求まらないためであり,引き算される配列が引き算する配列の真部分集合の場合にも結果が空集合となり解が求まらないためです.

Array1&Array2

 Array1 の配列要素全体を A, Array2 の配列要素全体を B とすると Array1 から Array2 を差し引いた差分は下式で表現されます.

Array1 - Array2 = A\ AND\ (not B) = A \cap \neg B

 二重ループによりそれぞれの要素を比較して一致した数を求めていますが,これは積集合を取っていることに他なりません.EXCELワークシートにおいて数式の参照元の最初のセルおよび参照先の最後のセルを取得するでも述べましたが,2つの集合の和集合と積集合の要素数が等しければ元の2つの集合は全く同じです.ここでのロジックは積集合の要素数と元の集合の要素数が等しければ元の2つの集合は等しい筈であるとの前提に立っています.

Option Explicit

Function COMPARE_ARRAY(ByRef Array1() As String, ByRef Array2() As String) As Boolean
    Dim i   As Long
    Dim j   As Long
    Dim k   As Long
    k = 0
    For i = LBound(Array1) To UBound(Array1)
        For j = LBound(Array2) To UBound(Array2)
            If Array1(i) = Array2(j) Then
                k = k + 1
            End If
        Next j
    Next i
    If i = j And i = k Then
        COMPARE_ARRAY = True
    Else
        COMPARE_ARRAY = False
    End If
End Function

Function PROPERSUBSET_ARRAY(ByRef Array1() As String, ByRef Array2() As String) As Boolean
    Dim i   As Long
    Dim j   As Long
    Dim k   As Long
    k = 0
    For i = LBound(Array1) To UBound(Array1)
        For j = LBound(Array2) To UBound(Array2)
            If Array1(i) = Array2(j) Then
                k = k + 1
            End If
        Next j
    Next i
    If k = i Then
        PROPERSUBSET_ARRAY = True
    Else
        PROPERSUBSET_ARRAY = False
    End If
End Function

 下記関数では第 3 引数の Compare の指定により Array1 から Array2 の差分を求めるか,Array2 から Array1 の差分を求めるかを指定しています.但し,配列内の要素にもともと空白文字列があった場合にはうまく動作しません.

Function EXCEPT_ARRAY(ByRef Array1() As String, ByRef Array2() As String, ByVal Compare As Boolean) As String()
    Dim i               As Long
    Dim j               As Long
    Dim k               As Long
    Dim InternalAr1()   As String
    Dim InternalAr2()   As String
    Dim Ar1Ar()         As String
    Dim Ar2Ar()         As String
    InternalAr1 = Array1
    InternalAr2 = Array2
    For i = LBound(InternalAr1) To UBound(InternalAr1)
        For j = LBound(InternalAr2) To UBound(InternalAr2)
            If InternalAr1(i) = InternalAr2(j) Then
                InternalAr1(i) = ""
                InternalAr2(j) = ""
                k = k + 1
            End If
        Next j
    Next i
    k = 0
    For i = LBound(InternalAr1) To UBound(InternalAr1)
        If InternalAr1(i) = "" Then
        Else
            ReDim Preserve Ar1Ar(k)
            Ar1Ar(k) = InternalAr1(i)
            k = k + 1
        End If
    Next i
    k = 0
    For j = LBound(InternalAr2) To UBound(InternalAr2)
        If InternalAr2(j) = "" Then
        Else
            ReDim Preserve Ar2Ar(k)
            Ar2Ar(k) = InternalAr2(j)
            k = k + 1
        End If
    Next j
    If Compare Then
        EXCEPT_ARRAY = Ar1Ar
    Else
        EXCEPT_ARRAY = Ar2Ar
    End If
End Function

参照:
EXCELワークシートにおいて数式の参照元の最初のセルおよび参照先の最後のセルを取得する

How to compare and get differences between 2 arrays in EXCEL VBA?

When you’d like to compare 2 arrays in EXCEL VBA whether they are equal or not, what would you do? Furthermore, you might get different elements that don’t overlap each other. I’d like to describe the code that how to get differences of 2 arrays.

At first, you would have to check whether they are equal each other or not because the difference of equal arrays is empty set. Next, you would have to check whether an array is proper subset of another array or not. At last, you could get difference between 2 arrays.

Array1&Array2

See formula as below, it is shown all elements of Array1 as “A”, all elements of Array2 as “B” and differences elements from Array1 and Array2 as “A And (not B)”.

Array1 - Array2 = A\ AND\ (not B) = A \cap \neg B

The following code compares elements between two set and get number of equal elements with double loop, that means to get intersection of 2 sets.

Option Explicit

Function COMPARE_ARRAY(ByRef Array1() As String, ByRef Array2() As String) As Boolean
    Dim i   As Long
    Dim j   As Long
    Dim k   As Long
    k = 0
    For i = LBound(Array1) To UBound(Array1)
        For j = LBound(Array2) To UBound(Array2)
            If Array1(i) = Array2(j) Then
                k = k + 1
            End If
        Next j
    Next i
    If i = j And i = k Then
        COMPARE_ARRAY = True
    Else
        COMPARE_ARRAY = False
    End If
End Function

Function PROPERSUBSET_ARRAY(ByRef Array1() As String, ByRef Array2() As String) As Boolean
    Dim i   As Long
    Dim j   As Long
    Dim k   As Long
    k = 0
    For i = LBound(Array1) To UBound(Array1)
        For j = LBound(Array2) To UBound(Array2)
            If Array1(i) = Array2(j) Then
                k = k + 1
            End If
        Next j
    Next i
    If k = i Then
        PROPERSUBSET_ARRAY = True
    Else
        PROPERSUBSET_ARRAY = False
    End If
End Function

Configuration of the 3rd argument “Compare” specifies which array should be excepted, when it was TRUE the function would except the latter from the former, when it was FALSE then it would except the former from the latter, respectively. It’s assumed that the elements of arrays has no empty string.

Function EXCEPT_ARRAY(ByRef Array1() As String, ByRef Array2() As String, ByVal Compare As Boolean) As String()
    Dim i               As Long
    Dim j               As Long
    Dim k               As Long
    Dim InternalAr1()   As String
    Dim InternalAr2()   As String
    Dim Ar1Ar()         As String
    Dim Ar2Ar()         As String
    InternalAr1 = Array1
    InternalAr2 = Array2
    For i = LBound(InternalAr1) To UBound(InternalAr1)
        For j = LBound(InternalAr2) To UBound(InternalAr2)
            If InternalAr1(i) = InternalAr2(j) Then
                InternalAr1(i) = ""
                InternalAr2(j) = ""
                k = k + 1
            End If
        Next j
    Next i
    k = 0
    For i = LBound(InternalAr1) To UBound(InternalAr1)
        If InternalAr1(i) = "" Then
        Else
            ReDim Preserve Ar1Ar(k)
            Ar1Ar(k) = InternalAr1(i)
            k = k + 1
        End If
    Next i
    k = 0
    For j = LBound(InternalAr2) To UBound(InternalAr2)
        If InternalAr2(j) = "" Then
        Else
            ReDim Preserve Ar2Ar(k)
            Ar2Ar(k) = InternalAr2(j)
            k = k + 1
        End If
    Next j
    If Compare Then
        EXCEPT_ARRAY = Ar1Ar
    Else
        EXCEPT_ARRAY = Ar2Ar
    End If
End Function

REFERENCE:
How to get first cell which is referred to formula and last cell which refers to formula in Excel worksheet?

複数のExcelブックの全シートのフィルターを解除する

 オートフィルターの設定されているシートを手作業でフィルター解除するのは手間がかかります.VBA から GetOpenFilename メソッドで複数のブックを指定し,すべてのシートからオートフィルターを解除する方法です.

Option Explicit

Sub RemoveAutoFilter()
    Dim Wb      As Workbook
    Dim Sh      As Worksheet
    Dim myPath  As Variant
    Dim i       As Long
    Application.ScreenUpdating = False
    myPath = Application.GetOpenFilename(FileFilter:="Microsoft Excelブック,*.xls?", MultiSelect:=True)
    If TypeName(myPath) = "Boolean" Then Exit Sub
    For i = LBound(myPath) To UBound(myPath)
        Set Wb = Workbooks.Open(myPath(i))
        For Each Sh In Wb.Worksheets
            If Sh.AutoFilterMode Then
                Sh.AutoFilterMode = False
            End If
        Next Sh
        Wb.Save
        Wb.Close
    Next i
    Application.ScreenUpdating = True
End Sub

参照:
Application.GetOpenFilename メソッド (Excel)

How to remove AutoFilter of all worksheets in multiple Excel workbooks?

It’s hard to remove manually AutoFilter of worksheets in multiple workbooks. I’d like to describe how to remove it with VBA.

Option Explicit

Sub RemoveAutoFilter()
    Dim Wb      As Workbook
    Dim Sh      As Worksheet
    Dim myPath  As Variant
    Dim i       As Long
    Application.ScreenUpdating = False
    myPath = Application.GetOpenFilename(FileFilter:="Microsoft Excel Book,*.xls?", MultiSelect:=True)
    If TypeName(myPath) = "Boolean" Then Exit Sub
    For i = LBound(myPath) To UBound(myPath)
        Set Wb = Workbooks.Open(myPath(i))
        For Each Sh In Wb.Worksheets
            If Sh.AutoFilterMode Then
                Sh.AutoFilterMode = False
            End If
        Next Sh
        Wb.Save
        Wb.Close
    Next i
    Application.ScreenUpdating = True
End Sub

Reference:
Application.GetOpenFilename Method (Excel)

Bayesian information criterion

If sample size (n) was so large enough, Bayesian information criterion (BIC), an evaluation criteria of model estimated by maximum likelihood method, would be approximated with Laplace method by integrating marginal likelihood corresponding to posterior probability of model. θ is a parameter of p-dimension and f(xn|θ) is probability distribution function, respectively.

\displaystyle BIC = -2\log f(x_n|\hat\theta) + p\log n

References:
Probability density function, expected value and variance of each probability distribution
How to calculate Akaike information criterion with probability distribution function?

ベイズ型情報量基準

 ベイズ型情報量基準 (BIC) は最尤法によって推定されたモデルの評価基準であり,サンプルサイズ n が十分に大きい時にモデルの事後確率に対応する周辺尤度を積分のラプラス法で近似して得られます.θ は p 次元パラメータ,f(xn|θ) は確率分布関数です.赤池情報量基準との違いは罰則項の係数が AIC では 2 に固定してあったのに対し, BIC ではサンプルサイズ n の自然対数を乗じているところにあります.

\displaystyle BIC = -2\log f(x_n|\hat\theta) + p\log n

参照:
確率分布ごとの確率密度関数および期待値と分散
赤池情報量基準(AIC)を確率分布関数から最尤法を用いて計算する

How to calculate Akaike information criterion with probability distribution function?

Akaike information criterion (ACI) is the most useful indicator to select variables in multivariate analysis. It’s assumed that N is free parameter number, ACI is calculated as below;

\displaystyle AIC = -2(Maximum\ Log\ Likelihood)+2N

Free parameter number of model is dimension of the space that parameter value could take in expected models. AIC is an evaluation criterion when expected model is estimated with maximum likelihood method and it indicates that log likelihood bias approximates to free parameter number included in model.

How to find maximum log likelihood? Let’s define log likelihood function as following equation;

\displaystyle l(\theta) = \sum_{\alpha=1}^{n}\log f(x_{\alpha}|\theta)

\hat\theta, that is maximum likelihood estimator, maximizes l(θ) and this is called as maximum-likelihood method. l(\hat\theta) = \Sigma_{\alpha=1}^{n}\log f(x_\alpha |\hat\theta) is called as maximum log-likelihood.

If log likelihood function (l(θ)) could be differentiable, maximum likelihood estimator (\hat\theta) would be given by solving differentiated likelihood equation.

\displaystyle \frac{\partial l(\theta)}{\partial \theta} = 0

References:
Probability density function, expected value and variance of each probability distribution

赤池情報量基準(AIC)を確率分布関数から最尤法を用いて計算する

 多変量解析の際の変数選択の一つの指標として赤池情報量基準 (Akaike information criterion) があります.詳細は成書を参考にしていただきたいのですが,N を自由パラメータ数とすると下式で求まります.

\displaystyle AIC = -2(Maximum\ Log\ Likelihood)+2N

 モデルの自由パラメータ数とは,想定したモデルに含まれるパラメータの値が動く空間の次元のことです.AIC は想定したモデルを最尤法で推定した時の評価基準であり,対数尤度のバイアスが漸近的にモデルに含まれる自由パラメータ数となることを示しています.

 最大対数尤度はどう求めるのでしょうか.ここで下式のように対数尤度関数を定義します.f(x|θ) は確率分布関数であり,分布によって形が変化します.

\displaystyle l(\theta) = \sum_{\alpha=1}^{n}\log f(x_{\alpha}|\theta)

 この l(θ) を最大化する \hat\theta が最尤推定量であり,この方法を最尤法といいます.l(\hat\theta) = \Sigma_{\alpha=1}^{n}\log f(x_\alpha |\hat\theta) を最大対数尤度と呼びます.

 対数尤度関数 l(θ) が微分可能な場合,最尤推定量 \hat\theta は尤度方程式を微分した解が 0 となる θ を求めることで求まります.

\displaystyle \frac{\partial l(\theta)}{\partial \theta} = 0

参照:
確率分布ごとの確率密度関数および期待値と分散

How to check publication bias with funnel plot?

In systematic review or meta-analyses, multiple cohort studies and randomized controlled studies are integrated and conducted more precise analysis. However, it’s impossible to avoid publication bias because non-significant studies are less likely to be posted and published. If systematic reviews or meta-analyses with publication bias were conducted, incorrect treatment would be accepted. Funnel plot is one of methods to assess whether there is publication bias or not.

Scatter plot inverse of standard error on vertical axis against odds ratio or hazard ratio on horizontal axis. If there was no publication bias, funnel plot would be symmetrical. However, if there was publication bias, funnel plot would be asymmetrical.

It is required to calculate standard error in order to draw funnel plot, if point estimated of the effect size and its 95 % confidence interval are known, they are described in most of systematic reviews and meta-analysis, you can find standard error as following;

\displaystyle \mathrm{95\%CI} = Exp(LN(\mathrm{ES})\pm1.96\times\mathrm{SE})\\  \mathrm{SE}=\frac{LN(\mathrm{ES}/\mathrm{95\%LL})}{1.96}=\frac{LN(\mathrm{95\%UL}/\mathrm{ES})}{1.96}

ES: effect size, SE: standard error, 95%CI: 95 % confidence interval, 95%LL: 95 % Lower Limit, 95%UL: 95 % Upper Limit

References:
Bias in meta-analysis detected by a simple, graphical test (pdf)
A note on graphical presentation of estimated odds ratios from several clinical trials
Funnel plot (Wikipedia)

Bias in meta-analysis detected by a simple, graphical test

Matthias Egger, George Davey Smith, Martin Schneider, Christoph Minder

Abstract

Objective

Funnel plots (plots of effect estimates against sample size) may be useful to detect bias in meta-analyses that were later contradicted by large trials. We examined whether a simple test of asymmetry of funnel plots predicts discordance of results when meta-analyses are compared to large trials, and we assessed the prevalence of bias in published meta-analyses.

Design

Medline search to identify pairs consisting of a meta-analysis and a single large trial (concordance of results was assumed if effects were in the same direction and the meta-analytic estimate was within 30% of the trial); analysis of funnel plots from 37 meta-analyses identified from a hand search of four leading general medicine journals 1993-6 and 38 meta-analyses from the second 1996 issue of the Cochrane Database of Systematic Reviews.

Main outcome measure

Degree of funnel plot asymmetry as measured by the intercept from regression of standard normal deviates against precision.

Results

In the eight pairs of meta-analysis and large trial that were identified (five from cardiovascular medicine, one from diabetic medicine, one from geriatric medicine, one from perinatal medicine) there were four concordant and four discordant pairs. In all cases discordance was due to meta-analyses showing larger effects. Funnel plot asymmetry was present in three out of four discordant pairs but in none of concordant pairs. In 14 (38%) journal meta-analyses and 5 (13%) Cochrane reviews, funnel plot asymmetry indicated that there was bias.

Conclusions

A simple analysis of funnel plots provides a useful test for the likely presence of bias in meta-analyses, but as the capacity to detect bias will be limited when meta-analyses are based on a limited number of small trials the results from such analyses should be treated with considerable caution.

Key messages

  • Systematic reviews of randomised trials are the best strategy for appraising evidences; however, the findings of some meta-analyses were later contradicted by large trials
  • Funnel plots, plots of the trials’ effect estimates against sample size, are skewed and asymmetrical in the presence of publication bias and other biases
  • Funnel plot asymmetry, measured by regression analyses, predicts discordance of results when meta-analyses are compared with single large trials
  • Funnel plot asymmetry was found in 38% of meta-analyses published in leading general medicine journals and in 13% of reviews from Cochrane Database of Systematic Reviews
  • Critical examination of systematic reviews for publication and related biases should be considered a routine procedure

出版バイアスの有無をfunnel plotにより確認する

 システマティックレビューやメタアナリシスにおいて,複数のコホート試験や無作為化比較試験のデータを統合したり累積メタアナリシスを行うなどしてより精度の高い解析を行います.しかしながらそこには出版バイアスという偏りを避ける事はできません.陰性の結果の出た試験,無効の結果の出た試験などは投稿されにくく,採用されにくい傾向があるためです.仮に出版バイアスのかかった論文ばかりでシステマティックレビューやメタアナリシスが行われた場合,誤った治療法が選択される危険性が高まります.funnel plot はそのような出版バイアスを確認するための方法です.

 横軸にオッズ比や相対危険度,ハザード比などを取り,縦軸には標準誤差の逆数を取ってプロットします.標準誤差はサンプルサイズに依存するため,サンプルサイズが大きいほど標準誤差は小さくなり,従ってその逆数は大きくなります.複数の試験を funnel plot にプロットすると,理想的な状態では漏斗をひっくり返したような左右対称の形になります.しかし出版バイアスが存在する場合はいずれか片方がすっぽり抜け落ちた形になります.

 ファンネルプロットを描くには標準誤差を求める必要がありますが,効果量の点推定値およびその 95 % 信頼区間が分かっている場合,大抵のシステマティックレビューやメタアナリシスには掲載されているものですが,下記の計算で標準誤差を求めることができます.

\displaystyle \mathrm{95\%CI} = Exp(LN(\mathrm{ES})\pm1.96\times\mathrm{SE})\\  \mathrm{SE}=\frac{LN(\mathrm{ES}/\mathrm{95\%LL})}{1.96}=\frac{LN(\mathrm{95\%UL}/\mathrm{ES})}{1.96}

ES: effect size, SE: standard error, 95%CI: 95 % confidence interval, 95%LL: 95 % Lower Limit, 95%UL: 95 % Upper Limit

References:
Bias in meta-analysis detected by a simple, graphical test (pdf)
A note on graphical presentation of estimated odds ratios from several clinical trials
Funnel plot (Wikipedia)

Bias in meta-analysis detected by a simple, graphical test

Matthias Egger, George Davey Smith, Martin Schneider, Christoph Minder

要約

対象

 ファンネルプロットはサンプルサイズに対する効果の推定値をプロットしたものであり,大規模試験により後ほど矛盾を示すメタアナリシスにおけるバイアスを検出するのに有用かもしれない.我々はメタアナリシスを大規模試験と比較した際に結果の不一致をファンネルプロットの非対称性が予測するか否か試験し,出版されたメタアナリシスのバイアスの有病率を評価した.

デザイン

 メタアナリシスと単施設大規模試験のペアを同定するため Medline 検索(結果の一致は効果が同じ方向を向いており,メタアナリシスの推定値が試験の 30 % 未満であると仮定している). 1993 年から 1996 年までの 4 つの主要な一般的な医学雑誌から手動で検索した中から抽出した 37 のメタアナリシスと,1996 年二回目に発行された Cochrane Database of Systematic Reviews から抽出した 38 のメタアナリシス.

主要転帰計測

 精度に対する標準正規偏差の回帰から切片により測定されたファンネルプロット非対称性の程度.

結果

 同定された 8 対のメタアナリシスと大規模試験において(5 対は心血管医療から抽出され 1 対は糖尿病医療から,1 対は老人医療から,1 対は周産期医療から)4 対は一致し,4 対は一致しなかった.不一致のケースは皆,より大規模な試験で証明されたメタアナリシスだった.ファンネルプロットの非対称性は不一致の 4 対のうちの 3 対に出現していたが,一致していた対には全く出現しなかった.14 雑誌 (38 %) のメタアナリシスと 5 雑誌 (13 %) のコクランレビューにおいてファンネルプロットの非対称性はバイアスが存在することを示唆していた.

考察

 ファンネルプロットという簡便な解析により,メタアナリシスにおけるバイアスが存在するらしいことの有用なテストをもたらす.しかし検出許容はメタアナリシスが小規模試験の限定された数に基づく時に限られ,その結果は注意深く取り扱うべきである.

導入

 システマティックレビューは医療介入のリスクとベネフィットにおける最も有用なエビデンスであり,臨床研究と公衆衛生における意思決定を通知するものである.そのようなレビューは可能ならいつでもメタアナリシスに基づくべきである.『解析者によって考慮されたいくつかの独立した臨床試験を結合するか統合した統計解析は,結合可能であるべきだ』と.しかしながら,いくつかのメタアナリシスの所見は後により大規模な無作為化比較試験によって矛盾が明らかになるものである.そのような不一致は技術を広く傷つけて,最初から論争の的になってきた.メタアナリシスがミスリーディングしているように見えるのは出版バイアスや多くの他のバイアスの存在を考えれば驚くことではなく,ロケーションや選択,研究の結合により導入されるのかも知れない.

 ファンネルプロットはサンプルサイズに対する試験の効果推定値をプロットしたものであり,メタアナリシスの検証を評価するのに有用かもしれない.そのファンネルプロットというのは以下の事実に基づいている.基礎治療効果の推定における精度は,要素となる研究のサンプルサイズが増えるに従い増加する.小規模試験の結果はグラフの底辺に広く分布し,試験がより大規模になるほど狭くなる.バイアスの存在しない状態では分布は左右対称の逆さまの漏斗に似た形をする筈である.逆に,もしバイアスが存在するならファンネルプロットは歪み,非対称になる筈である.

 ファンネルプロットの価値はこれまで系統的に検証されたことがなく,対称性(または非対称性)は通常,主に視覚的な検査によって非公式に定義されただけであった.当然ながら,ファンネルプロットは観察者によって異なって解釈されてきた.我々はファンネルプロットの非対称性を数値的に計測し,同じテーマを扱ったメタアナリシスと大規模試験を比較した時,その非対称性が結果の不一致を予測するかどうかを試験した.我々はファンネルプロットの非対称性の有病率,つまりバイアスの存在を評価するために同じ方法を用いた.主要な一般医学雑誌で出版されたメタアナリシスと,Cochrane 共同計画で電子的に普及しているメタアナリシスを用いた.

方法

ファンネルプロットの非対称性の計測

 我々は線形回帰法を用いてファンネルプロットの非対称を計測し,オッズ比の自然対数スケールを用いた.現在の状況では回帰直線が原点を通るという制約を課されないにも関わらず,これは Galbraith の放射状プロットの回帰分析に対応している.標準正規偏差はオッズ比をそれ自身の標準誤差で除したと定義されるが,推定精度に対して回帰し,後者は標準誤差の逆数として定義される(回帰式は次のように定義される:SND = a + b x precision).精度が主にサンプルサイズに依存するように,小規模試験は x 軸上では 0 に近づく.小規模試験はオッズ比の統一値からの差異を提供するが,標準誤差が大きくなるために結果として標準正規偏差は 0 点に近くなる.小規模試験は両軸共に 0 点,つまり原点に近づく筈である.逆に大規模試験は正確な推定値をもたらし,もし治療が有効なら大きな標準正規偏差をもたらす.試験の集合が同質ならその点は選択バイアスによって歪まず,標準正規偏差がゼロとなる (a = 0) 原点を通る直線上に分布するはずであり,傾き b は効果のサイズと方向を示している.この状況は左右対称のファンネルプロットに対応する.

 仮に非対称が存在する場合,系統的大規模試験の結果とは異なる結果が小規模試験で出るように,回帰直線は原点を通らない筈である.切片 a は非対称性の計測を提供する.ゼロからの偏差が大きいほど非対称がより顕著となる.小規模試験がより大きく強固な効果を有するなら,対数軸の原点より下に回帰直線が来るようになるはずである.それ故,陰性の結果は小規模試験においては大規模試験よりもより顕著な利益を示唆するはずである.ある状況では(例えばいくつかの小規模試験と1つの大規模試験が存在するような場合),推定効果の分散の逆数により解析に加重することによって検出力が上昇する.我々は加重した場合としない場合の両者について検討し,解析の結果を用いてより 0 からの偏差が大きな切片を求めた.

 異質性のすべての検査とは対照的に,ファンネルプロットの非対称性テストは異質性を特異的に評価し,この状況ではより強力なテストを提供する.しかしながら,どんな異質性の解析もメタアナリシスに含まれる試験の数に依存しており,それらは一般に小規模で,試験の統計学的検出力に限界がある.それ故我々は非対称性の根拠を P < 0.1 に設定した.そして切片を 90 % 信頼区間で表現した.同じ有意水準をメタアナリシスにおける異質性の以前の解析にも用いた.

メタアナリシスとマッチングする大規模無作為試験の同定

(中略)

結果の一致・不一致

(中略)

ファンネルプロットにおける非対称性の頻度

(中略)

結果

 メタアナリシスと大規模試験を含んでいる 8 対が同定された (Table 1).5 対は心血管医学,1 対は糖尿病医学,1 対は老人医学,1 対は周産期医学からだった.大規模試験の精度が 14.4 であるのと比較してメタアナリシスからの効果推定値は平均精度 7.9 を有していた.4 対の一致と 4 対の不一致とがあった (Fig 1).全例において不一致はメタアナリシスの結果であり,それらは大規模試験よりも有益な効果を証明したものであった.メタアナリシスの 4 分の 3 の不一致はメタアナリシスが統計的有意 (P < 0.1) にファンネルプロットの非対称性を示していた.一致した対のファンネルプロットは全く有意な非対称を示さなかった (Fig 2, Table 2).

Fig.1

Fig.2

 大規模試験よりも数年早く出版された 3 つのメタアナリシスのための付加的な試験が同定された.これらは更に最近のメタアナリシスから抽出された.心筋梗塞におけるマグネシウム静注試験のメタアナリシスが 5 つの付加的な試験とともに更新された時,その切片はより大きな非対称性を示した (- 1.36 (90%CI – 2.06 to – 0.66), P = 0.05).13 の付加的試験が心不全に対する ACE 阻害薬の試験の解析に加えられた時,散布図はまだ対称性を保っていた (切片 0.07 (- 0.53 to 0.67), P = 0.85).氏子癇前症予防のためのアスピリンの解析が更新された時には 9 つの付加的試験が追加され,ファンネルプロットは非対称性となった (切片 – 1.49 (- 2.20 to – 0.79), P = 0.003) (Fig 3).

Fig.3

 Figure 4 に 38 の Cochrane レビューおよび 37 の雑誌のメタアナリシスの回帰切片の分布を示した.バイアスが存在しない状態ではランダムな変動により切片はゼロ点を中心に対称性に集まる筈であり,陽性値と陰性値が同数となる筈である.しかし観察された結果はそうではなかった.分布は陰性値に偏位しており,Cochrane レビューにおいては平均で – 0.24 (- 0.65 to 0.17), 雑誌のメタアナリシスにおいては – 1.00 (- 1.50 to – 0.49) であった.Cochrane レビューでは切片には 24 の陰性値と 14 の陽性値が存在し (sign test, P = 0.10),雑誌のメタアナリシスにおいては 26 の陰性値と 11 の陽性値が存在した (sign test, P = 0.007).Cochrane レビューの 5 編 (13%) と雑誌メタアナリシスの 14 編 (38%) に統計的に有意な非対称性の根拠を認めた.

Fig.4

考察

 無作為化比較試験から陽性の所見だけを選択して出版することは参考文献のメタアナリシスレビューにおいて考慮すべき懸念である.仮に参考文献が治療効果の利益を証明する試験が懸念される場合,そして治療効果が無いことを証明した等しく有効な試験が出版されないままであった場合,果たしてこれらの参考文献のシステマティックレビューは臨床診療や保健政策の意思決定においてどれだけ客観的な指標として役立つであろうか.このような出版バイアスのこの潜在的に深刻な結果は暫くの間認識されており,世界規模の登録の開始時には繰り返し呼ばれてきた.試験の登録と,出版された試験とされなかった試験との結果を保持するデータベースを構築すれば問題は解決するにもかかわらず,当面それが広く提起される様子はなさそうだ.

 出版バイアスとそれに関連するバイアスを持った臨床試験はそれ故メタアナリシスとシステマティックレビューの根幹となる.ここで示した所見は次のことを示唆している.簡素な図形と統計手法がこの目的には有用であると.同じ介入に対するメタアナリシスと大規模単一試験との両者一対のこの方法を試験する時には,我々はファンネルプロットにより4分の3以上の不一致の結果に非対称性を見出した.4番目はたった6つの試験に基づいているのみで,さらなる試験により更新された時には非対称性が現れてきた.

ファンネルプロット非対称性のソース

 出版バイアスはファンネルプロットの非対称性と関連してきた.にも関わらず出版された試験においては,メタアナリシスに関連した試験を同定する確率もまたそれらの結果に影響される.英語の言語バイアス,英語以外の言語で出版された雑誌に『陰性』所見が優遇して出版されるということだが,地域と包含を作り出し,そのような研究を含める可能性が低くなる.引用バイアスの結果として『陰性』となった試験は引用される頻度がより低くなり,関連する試験を検索する際により見逃されやすくなる.『陽性』試験の結果はしばしば一度ならず報告され,メタアナリシス(複数の出版バイアス)のために配置される確率を高くする.これらのバイアスは大規模試験よりも小規模試験の方に影響を与えているようである.

Selection bias

  • Publication bias
  • Location biases

True heterogeneity

  • Size of effect differs according to study size

Data iregularities

  • Poor methodological design of small studies
  • Inadequate analysis
  • Fraud

Artefactual

  • Choice of effect measure

Chance

 非対称性の他の源は手法の品質の差から生じる.より小規模な試験は一般的に大規模試験よりも方法論的に厳しさに欠けて実施され,解析される.低質の研究はまたより大きな効果を証明しがちである.ファンネルプロットに見られる対称性の程度は,効果を測定するために実施される統計量に依存するのかもしれない.イベント発生率の高いリスクにおいて,オッズ比はリスク減少や上昇を過大評価する.このことから,小規模試験が一貫して高リスク患者において実施されるとファンネルプロットの非対称性を導く結果となる.同様に,もしイベントが一定の率で発生するなら,観察期間が延長するにともなって相対危険度は単一の値に向かって移動する筈である.大規模試験においては観察期間は小規模試験のそれよりもしばしば長くなる.最終的に非対称のファンネルプロットは偶然にしか発生しなくなる.

 ファンネルプロットに示された試験は介入における内在する同じ効果を推定しないかもしれず,それぞれの結果の間のそのような異質性はファンネルプロットの非対称性に至るかもしれない.例えば,結合された転帰が次とみなされたら,介入によって影響を受ける結合された転帰の要素のため,高リスクの患者においてのみ,かなりの利益が見られるかもしれない.コレステロール低下薬は冠動脈疾患による死亡率を低下させ,高リスク患者における全死亡率に大きな効果をもたらした.その患者とは高脂血症と同定された無症候性の患者よりも冠動脈疾患と診断の確定した患者である.これが冠動脈疾患による一貫した死亡リスク低下から,高リスク患者における患者の全死因を減少させることへと敷衍されることの根拠であり,全死亡のより大きな割合が冠動脈疾患になる筈だった患者である.仮に小規模試験が高リスク患者に実施されればファンネルプロットに非対称性を生じる結果となるはずである.

 より大規模な試験が確立する前には一般に小規模試験が実施される.現在に至るまで,対照群の治療法は実験的治療の効能を低下させる方法で改善し,変化してきた.心筋梗塞に対するマグネシウム静注の効果を調べた試験で観察された結果との乖離の説明として,そのような機序が提案されてきた.この解釈は臨床試験のデータからは支持されていないのだが.結局のところ,ある介入は大規模試験においてはより徹底されずに実施されるのかもしれず,故により小規模な試験ほど最も陽性の結果が出ることを説明しているのかもしれない.我々のメタアナリシスと大規模試験との比較を考慮すると,介入の 1 つで起こりうる,つまり入院高齢者紹介のことだが.

 それゆえ全く異なる機序が箱形に要約されたファンネルプロットにおいて導かれる可能性がある.しかしこのことは重要な記録である,研究がメタアナリシスとして結合される時には,つまりこれはいつも偏った全ての推定値と関連していると.非対称性がもっと顕著になると,バイアスの量が相当なものとなる筈である.この法則の例外は非対称性が偶然だけによって起きた場合にのみ発生する.

メタアナリシスにどの程度の頻度でバイアスが存在するか

(中略)

結論

 多くの医療介入にとって大規模で決定的な試験を欠いた状態では,無作為化比較試験に基づくシステマティックレビューはエビデンスを鑑定するための最も明らかな方法である.選択バイアスと他のバイアスはこのアプローチに極めて深刻な脅威をもたらすものの,しかしながら,信用出来なくなるメタアナリシスを避けるために注意を払うべきである.ここで議論した手法はこの目的に寄与するはずであり,恐らく存在するか又は見かけ上存在しない筈のそのようなバイアスを再現可能な計測を提供する筈である.これは簡単に計算でき,要約統計量を提供する.空間上の制限からファンネルプロットの図示が許可されない時に報告可能な要約統計量である.更に方法論的調査が求められるにもかかわらず,出版物の存在と関連するバイアスのため医療研究はルーチン作業として考慮されるべきである.しかしながらメタアナリシスがもっぱら小規模試験に基づく時には,そのようなバイアスを発掘する余地は限られている.このような状況では統計的解決法はなく,そのような解析結果はそれゆえ注意深く扱うべきである.

Key messages

  • Systematic reviews of randomised trials are the best strategy for appraising evidences; however, the findings of some meta-analyses were later contradicted by large trials
  • Funnel plots, plots of the trials’ effect estimates against sample size, are skewed and asymmetrical in the presence of publication bias and other biases
  • Funnel plot asymmetry, measured by regression analyses, predicts discordance of results when meta-analyses are compared with single large trials
  • Funnel plot asymmetry was found in 38% of meta-analyses published in leading general medicine journals and in 13% of reviews from Cochrane Database of Systematic Reviews
  • Critical examination of systematic reviews for publication and related biases should be considered a routine procedure

Systematic Review and Meta-Analysis: Anti-Tumor Necrosis Factor α Therapy and Cardiovascular Events in Rheumatoid Arthritis

Biological agents like anti-TNF α may have benefit not only in reduction of inflammation but also in reduction of cardiovascular event risk on rheumatoid arthritis. This article is systematic review that selects observational cohort studies and randomized controlled trials, the former is statistically significant but the latter is not, respectively. Analysis for publication bias suggested publication bias for all cardiovascular events, so it may be too early to conclude.

Funnelplot

Systematic Review and Meta-Analysis: Anti-Tumor Necrosis Factor α Therapy and Cardiovascular Events in Rheumatoid Arthritis

CHERYL BARNABE, BILLIE-JEAN MARTIN, AND WILLIAM A. GHALI

Arthritis Care & Research vol. 63, No. 4, April 2011, pp 522-529

Abstract

Objective

Control of rheumatoid arthritis (RA) may reduce the risk of cardiovascular events. We sought to systematically assess the association between anti–tumor necrosis factor α (anti-TNFα) therapy in RA and cardiovascular event rates.

Methods

Observational cohorts and randomized controlled trials (RCTs) reporting on cardiovascular events (all events, myocardial infarction [MI], congestive heart failure, and cerebrovascular accident [CVA]) in RA patients treated with anti-TNFα therapy compared to traditional disease-modifying antirheumatic drugs were identified from a search of PubMed (1950 to November 2009), EMBase (1980 to November 2009), and conference abstracts. Relative risks (RRs) or hazard ratios and 95% confidence intervals (95% CIs) were extracted. If the incidence was reported, additional data were extracted to calculate an incidence density ratio and its variance.

Results

The systematic review and meta-analysis include 16 and 11 publications, respectively. In cohort studies, anti-TNFα therapy was associated with a reduced risk for all cardiovascular events (pooled adjusted RR 0.46; 95% CI 0.28, 0.77), MI (pooled adjusted RR 0.81; 95% CI 0.68, 0.96), and CVA (pooled adjusted RR 0.69; 95% CI 0.53, 0.89). Meta-analysis of RCTs also produced a point estimate indicating lower risk of cardiovascular events, but this was not statistically significant (pooled RR 0.85; 95% CI 0.28, 2.59).

Conclusion

Anti-TNFα therapy is associated with a reduced risk of all cardiovascular events, MI, and CVA in observational cohorts. There was heterogeneity among cohort studies and possible publication bias. The point estimate of the effect from RCTs is underpowered with wide 95% CIs, and cardiovascular events were secondary outcomes, but RCTs also demonstrated a trend toward decreased risk.

Systematic Review and Meta-Analysis: Anti-Tumor Necrosis Factor α Therapy and Cardiovascular Events in Rheumatoid Arthritis

 関節リウマチに対する生物学的製剤の使用は炎症を効率よく改善させるだけでなく,心血管イベントリスクを減少させるかもしれないという系統的レビューです.観察コホート試験と無作為化比較試験を選択したのですが無作為化比較試験では統計的有意ではなかったとのことです.コホート試験では統計的有意な結果が出ましたが出版バイアスの可能性があり,結論を出すには時期尚早と思われます.
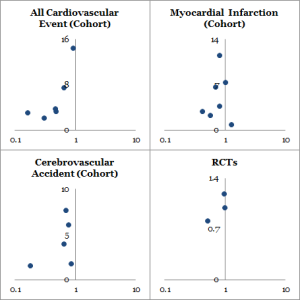
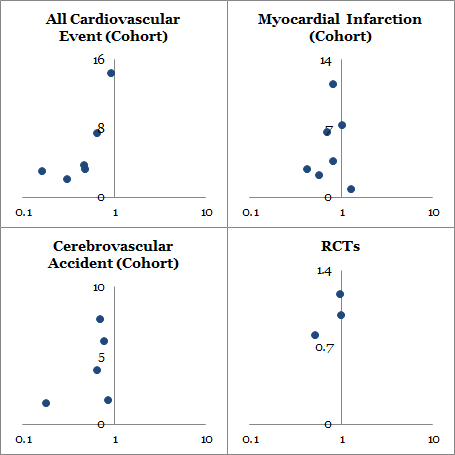
Funnelplot

Systematic Review and Meta-Analysis: Anti-Tumor Necrosis Factor α Therapy and Cardiovascular Events in Rheumatoid Arthritis

CHERYL BARNABE, BILLIE-JEAN MARTIN, AND WILLIAM A. GHALI

Arthritis Care & Research vol. 63, No. 4, April 2011, pp 522-529

対象

 関節リウマチの制御は心血管イベントのリスクを減弱させているかもしれない.我々は抗TNF-α 治療と心血管イベント発症率との間の相関を系統的に評価しようとした.

方法

 観察コホートと無作為化比較試験のうち,抗 TNF-α 治療と伝統的な DMARDs 治療法とを比較したリウマチ患者で心血管イベント(全イベント,心筋梗塞,うっ血性心不全,脳血管疾患)について記載のあるものを PubMed および EMBase およびカンファレンスの要約から同定した.相対危険度またはハザード比とその 95% 信頼区間を抽出した.インシデントが報告された場合は罹患密度とその分散を計算するために付加情報も抽出した.

結果

 系統的レビューとメタ解析はそれぞれ 16 編と 11 編が含まれた.コホート試験においては抗 TNF-α 治療は全血管イベントの相対危険度と相関しており,調整後の相対危険度と 95% 信頼区間はそれぞれ 0.46 (0.28-0.77) であった.心筋梗塞については 0.81 (0.68- 0.96) であった.また脳血管疾患については 0.69 (0.53 -0.89) であった.無作為化比較試験のメタ解析では心血管イベントのリスクの低下を示唆する点推定値が得られたが,統計的有意ではなかった(相対危険度 0.85,95% 信頼区間 0.28-2.5).

結論

 観察研究における抗 TNF-α 治療は全心血管イベント,心筋梗塞,脳血管障害のリスク低下と相関している.コホート試験と出版バイアスとの間には異質性がある.無作為化比較試験での点推定値は 95% 信頼区間で力不足であり,心血管イベントは secondary outcome であったが,無作為化比較試験はリスクを減少させる傾向にあることを証明した.

導入

 関節リウマチは慢性炎症性疾患であり,心血管イベント発症リスクの増加と関連している (1-3).このことは伝統的な心血管リスク因子と不適切に治療された関節リウマチの炎症性環境 (4との両者に寄与している.過去 15 年間で関節リウマチに対する治療戦略は劇的に変化しており,DMARDs と生物学的製剤によって早期に寛解達成することが治療目標となった.関節リウマチ患者における心血管リスク因子が注目されるようになったのは,この集団における心血管死亡率と罹患率の上昇が広く認識されるようになったことによる.

 リウマチの疾患活動性を適切に維持することで炎症を有効に治療することは心血管イベントのリスクを減少させるかもしれない.最近の系統的レビューによると,メソトレキセートが心血管イベントリスクに対して有効であると明らかになった (5).抗 TNF α 治療はメソトレキセートや他の標準的 DMARDs が失敗した患者にとって切り札となる治療法である.抗 TNF α 治療が付加的にリスクを抑止することは明らかで,心血管疾患の代理マーカーに良い意味でのインパクトを有することが証明されたように.以下の点が明らかになった,例えば循環血中の CRP や IL-6 など.他の内皮機能測定値のうち,頸動脈内膜肥厚と flow mediated dilatation を改善させる (6-7).

 治療されたリウマチ患者の大規模コホートの組立は特異的な治療法の転機を評価する機会を国際的に与えており,同時に副作用の情報をも提供している.抗 TNF α 治療の転帰と副作用に関する有意な量のエビデンスは無作為化比較試験により蓄積される.我々はどんな可能性でも抗 TNF α 治療の心血管イベントリスクに関する臨床効果を定義するため,エビデンスのこれらの2つのソース,つまりコホート試験と無作為化比較試験とを系統的にレビューしたかった.特に,我々の疑問は次のようなものであった,リウマチ患者における抗 TNF α 治療と DMARDs 治療とを比較して心血管イベントリスクは観察コホートと無作為化比較試験とで同定されるか否かを試驗しているかである.

対象と方法

 系統的レビューとメタ解析は Preferred Reporting Themes for Systemic Revs ad Meta Analysis Group ガイドラインで概説されたフレームワークに従って実施され,報告における標準化と品質を向上させた (8).レビューのプロトコールは文献検索の前に開発された(著者の連絡先から可能な検索).

データソースとリサーチ

 我々は PubMed (1950 – 2009/11/1) および EMBase (1980 – 2009/11/1) の系統的文献検索を実施した.関連する記述のレビュー原著および参考文献リストの鍵となる原著はさらに関連出版物から検索した.最近出版された専門家についてはどんな出版されていないデータについても接触して同定した.2007 年から 2009 年のリウマチ及び心臓病学会 (European League Against Rheumatism, Ameican College of Rheumatology, Canadian Rheumatology Association,American College of Cardiology, American Heart Canadian Cardiovascular Society) の年次総会の会議抄録もレビューした.詳細な明細や統計解析において付加的な情報が要求されるインスタンス内で対応する筆者に直接接触した.タイトルや抄録で使われるキーワードや同義語を使用するにあたり,また医療対象者の見出しに使用するにあたり,3つのテーマが創造された.それらのテーマは『関節リウマチ』『心血管イベント』『抗 TNF α 治療』であった.これらの3つのテーマは抗 TNF α 治療を受けているリウマチ患者に発生する心血管イベント報告した研究を同定するため,ブール演算子の AND により結合して用いられた.加えて,『抗 TNF 治療』『関節 リウマチ』のテーマは結合され,我々はCochrane共同計画無作為化比較試験のフィルターを適用し,関節リウマチ患者で抗 TNF α 治療を受けている無作為化比較試験を同定した (9).

試験の選択

 2 名の著者 (CB and B-JM) は独立して原著をスクリーニングして全文レビューした.全タイトルと要約を先述の検索方法で取得してスクリーニングした.言語に制約は設けなかった.原著にリウマチ患者が抗 TNF α 治療を受け,心血管イベントをも報告している報告があれば含めた.我々の焦点が臨床的イベントに置かれていたため,動脈硬化の代理マーカーのみを報告しているものは除外した.最初のスクリーニングにおける賛同は 99.7 % であった.どんな原著であれ最初のスクリーニングで2名のいずれかの筆者により研究質問にとって陽性の関連を有しているとして同定されたものは全文レビューした.

 次のステップとして全文レビューに着手した.この段階では2つの研究デザインを考慮した.つまり観察コホート試験と無作為化比較試験である.リウマチ患者が抗 TNF α 治療と DMARDs と比較した治療を受け,心血管イベント(心筋梗塞,うっ血性心不全,脳血管障害)について言及したオリジナルのデータを報告していれば,原著には系統的レビューも含まれた.我々は観察期間が 26 週未満の報告は除外した.いかなる同定された有効性も確実らしいということと,短い治療期間における変化でないと保証するためである.第2段階で観察された合意は 95.9 % であった.2名の筆者間での食い違いは3人目の筆者 (WG) を交えた協議によって解決した.定量的メタ解析に含まれた研究は,同等の2群間での相対危険度の定義を可能にするための十分なデータを有していなければならないとされた.

データ抽出と品質評価

 データは両著者によって独立に抽出した.我々は患者の人口動態,場所の調査,観察期間を記録した.比較治療(メソトレキセートや DMARDs),リウマチの疾患活動性因子,心血管リスク因子または既存の条件も記録した.相対危険度またはハザード比および関連する 95% 信頼区間は直接抽出した.インシデントが報告された際には,罹患密度とその分散を計算するために両群でのイベント数と患者-年のフォローアップもまた抽出した.回帰モデルにおいて調整共変量が作成された場合にはデータ抽出の際に最も調整された相対危険度と同等のものを選択した.抗 TNF α 治療群と一般的リウマチ治療群との比較においては一般治療群が特定されない状況では DMARDs 治療を受けていると仮定した.研究品質を評価するのに必要な情報は Egger らによる観察コホート試験と無作為化比較試験のためのチェックリストに従い抽出した (10).

データ合成と統計解析

 関連性の尺度を計算するための十分なデータを公表していない研究はオリジナルの出版として公表された.彼らが同じ転帰を報告したとしても,我々は2つの研究デザインを1つにまとめなかった.というのは,メタ解析に十分な情報を持つコホート試験のために我々は,各々の転帰のための独立した解析における全心血管イベント,心筋梗塞,脳血管障害,うっ血性心不全の調整済み相対危険度を定義したからである.ハザード比と罹患密度比は直接相対危険度として考慮される.オッズ比として表現される結果は Zhang と Yu により記述された方法 (11) で相対危険度に変換された.メタ解析に十分な情報を持つ無作為化比較試験のため,抗 TNF α 治療群と対照群との間のイベントの相対危険度を計算した.我々はメタ解析には Stata (Stata-Corp) バージョン 10.0 を用い,観察研究を横断した対数変換した相対危険度を計算し,『めちゃくちゃな』無作為化比較試験のための相対危険度を指示した.観察コホートのため,我々は DerSimonian and Laird random-effect モデルを採用して全心血管イベントの転帰を評価し,fixed-effect モデルを採用して心筋梗塞と脳血管疾患の転帰を評価した.我々は fixed-effects モデルを採用して無作為化比較試験を評価した.コホート試験と無作為化比較試験の相対危険度および対数相対危険度並びにそれらの 95% 信頼区間を要約するために forest plot 法が開発された.コホート試験における経時的なエビデンス蓄積効果を同定するために, metacum なコマンドが使われた.

 研究の間の異質性は Cochrane Q 統計値および I2 統計値を用いて評価した.1つのコホート試験には Yates 変換が適用され,解析を実行した.というのはその研究 (Geborek et al, 12) にはイベントが発生しなかったためである.Begg test および funnel plot による可視化解析は出版バイアスを評価するために用いた.

結果

 全部で 5,022 の要約がデータベース検索方法から同定された.付加的な 7 つの出版物は手動での検索および協議の手続きにより同定された.5,029 の要約のうち 97 編が全文レビューに選択された (Figure 1).予め指定しておいた適合基準に基づいて 16 研究が系統的レビューに選択された.それらの研究の特徴を Table 1 に示した.要約すると,我々は 13 のコホート試験(106,202 名の患者)と 3 つの無作為化比較試験(2,126 名の患者)を同定した.イベントは研究によってばらつきがあり,全心血管イベント(5 つのコホート試験および 1 つの無作為化比較試験),心筋梗塞(6 つのコホート試験および 2 つの無作為化比較試験),脳血管疾患(4 つのコホート試験),うっ血性心不全(6 つのコホート試験)を含んでいた.4 つのコホート試験が全ての抗 TNF α 治療法を使用したと報告し,5 つのコホート試験が infliximab および etanercept に特化して報告し,4 つのコホート試験は infliximab, etanercept および adalimumab の使用を報告した.1 つの無作為化比較試験が infliximab, etanercept, adalimumab の使用を報告した.我々の検索には golimumab も含まれていたにもかかわらず,同定された研究にこの薬剤を使用したものはなかった.Table 2 に報告されたリスク測定および観察コホートにおける解析に用いた調整方法および共変量を示した.データ抽出を実施した後にメタ解析に耐えうると同定されたのは,たった 8 編のコホート試験と 3 つの無作為化比較試験だけであった.

研究品質

 コホート試験と無作為化比較試験は Egger (10) らによって提案された要素に従って評価された.Table 1 および Table 2 に研究品質を評価するのに要求される情報をまとめて示す.コホート試験の大部分においては患者サンプリングと転帰の評価は,コホート試験デザインにおける固有の限界を,出来るだけ客観的に与えられる.2 編のコホート試験 (Listing et al, 2008 [13], Dixon et al, 2007 [14]) は高品質と考えられ,11 編は中等度の品質とされた.中等度の品質の限界の大部分は,代表とコホートの疾患コースにおける時間ポイントを定義する情報が提供されない欠如である.1 つを除いた全てのコホート試験にとって,コホートに組み入れられた後の治療法は標準化もされず無作為化もされていなかった.現実の観察研究に期待されているように.5 つのコホート試験はベースラインでのリウマチや心血管危険因子について調整しておらず,これらのうち,事前に指定したメタ解析のための適合基準に合致していたのはたった 3 編であった.全ての無作為化比較試験は高品質であり,3 編の研究は盲検化,無作為割付,試験中の患者の流れを透明化する報告といったキー要素を有していた.

コホート試験結果

 全心血管イベント,心筋梗塞,脳血管障害を発症した例についての抗 TNF α 治療効果を forest plot を Figure 2 に示す.要約すると,抗 TNF α 治療は全心血管イベント発症のリスク減少と相関し(調整相対危険度は 0.46, 95% 信頼区間は 0.28-0.77),心筋梗塞については (0.81, 95%CI 0.68-0.96),脳血管障害は (0.69, 95%CI 0.53-0.89)であった.これらのエンドポイントの解析によって研究間の異質性が明らかになった.全心血管イベントに対する I2 = 89.3%, (異質確率 P < 0.001), 心筋梗塞については I2 = 39.9% (P = 0.139), 脳血管疾患については I2 = 39.3% (P = 0.176) であった.各々のエンドポイントに対して出版バイアスを解析した.外観検査は Begg’s test が有意な値 (P = 0.05) をもって全ての心血管イベントの出版バイアスを示唆していた.抗 TNF α 治療によって心血管イベントが増えたとする報告は少なかった.funnel plot による心筋梗塞と脳血管疾患は対照的であり,Begg’s test の値はそれぞれ P = 0.851, P = 0.174 であった.各々のエンドポイントについて報告した少数の研究では視覚的かつ統計的な funnel plot の解釈に限界があると報告していた.

 全てのコホート試験に対する累積メタ解析が実施され,転帰としての心筋梗塞を報告した研究について経時的な変化が起きるか評価し,この解析によって年余に渡り抗 TNF α 治療との間に有意な変化はないことが明らかになった.

 うっ血性心不全を転帰として報告した研究においては利用に足る数が十分でなかったことや,エンドポイントに関して一貫性を欠いた定義,協会の方向性が不確実に去るなどしたため,着手できなかった.我々はそれにもかかわらず,このエンドポイントについて報告した 6 つの研究に関する所見を提供した.Wolfe and Michaud は抗 TNF α 治療を受けた群では DMARDs 治療を受けた群と比較して全心不全イベント罹患率が 1.2 % (95%CI -1.9 – -0.5) 減少することを報告したが,発生例においては有意ではなかった (15).Carmona らは抗 TNF α 曝露群とメソトレキセート曝露群とのうっ血性心不全症例の率比が 0.14 (95%CI 0.06-0.32) であると同定した (16).Listing らのグループはうっ血性心不全発症したのは抗 TNF α 群では 25 名のうち 16 名であり,対してDMARDs でマッチさせた対照群では 25 名中 20 名であったと同定し,相対危険度は 0.8 (95%CI 0.56-1.14) であった (13).一方,Gole らの研究では抗 TNF α 治療群と DMARDs 群との間に心不全発症率に本質的な差異はないと明らかになった(103 名のうち 7 名に対して 100 名に対して 8 名, 相対危険度 0.85, 95%CI 0.32-2.26)(17).他の2つの研究では抗 TNF α 群で心不全のリスクが上昇した.Curtis らは 4.4 倍のリスク上昇を同定し,Setoguchi らは調整ハザード比が 2.1 (95%CI 1.0-4.3) と同定した (18, 19).

無作為化比較試験結果

 3 つの無作為化比較試験のメタ解析により,心血管イベント発症率の相対危険度が抗 TNF α 群において DMARDs 群と比較して 0.85 (95%CI 0.28-2.59) であると明らかになった (Figure 3).この 95% 信頼区間はとても広く,コホート試験のメタ解析で見つかった点推定値と 1.0 の両者を包含する.その研究では同質であることが明らかになった (I2 = 0%, P = 0.90).無作為化比較試験の所見からは統計的有意ではないものの,点推定値は効果においてコホート試験と同じ方向を示しており,心血管イベントにおいてはこの無作為化比較試験で差異を評価するには力不足であり,数が少なすぎることを認めざるをえない.

考察

 本系統的レビューとメタ解析は例の仮説を支持する,つまり抗 TNF α 製剤による治療はリウマチ患者の全心血管イベント,心筋梗塞,脳血管疾患のリスク減少と相関していると.リウマチ患者の死因において心血管疾患が 35-50% を占めていることから,この所見は大きな潜在的重要性を有している (20).全てのコホート試験が示したように,心血管疾患の転帰にもかかわらず,感度分析後も心血管イベントのリスク減少が証明された.更に,累積解析が証明したように,その効果は年余に渡り安定していた.少数の無作為化比較試験しかこの系統的レビューとメタ解析の適合基準に合致しなかったにもかかわらず,点推定値の方向は統計的有意ではなかったものの,リスクを減少させる方向に一致していた.

 コホート試験と無作為化比較試験との所見は一貫性のあるものか,乖離しているか結論付けるべきだろうか?統計的にはそれらは一貫しておらず,それゆえそれらは同じ効果を証明したものと主張される可能性がある.しかしながら,そのコホートの有効性の推定値は有意である一方,無作為化比較試験では有意でない.後者の推定値は 1.0 に近い.Concato らは既に,よくデザインされた観察コホート試験と無作為化比較試験との間の一般的な合同所見の値と関連性について議論している (21).彼らは次のように提案している.そのようなシナリオはよくあることであり,特異的な曝露効果が関心のある転機について結論するための付加的な堅牢性を提供していると.しかしながら,我々は “healthy user effect” の我々の結果への寄与の可能性について考慮すべきだろう (22).関節リウマチの文脈においては “healthy user” は一般に若く健康であり,より積極的な(抗 TNF α 製剤を含む)リウマチ管理のようなヘルスサービスを受ける傾向があり,潜在的に他の心血管因子を修飾する治療を受ける傾向にある.これは次のことを暗示している.つまり,患者間の素材の違いがあり,それは抗 TNF α 治療を受けているかそうでないかの違いであり,無作為化比較試験に対して相対的に(コホート試験においては測定不能な交絡因子はコントロール出来ないため)コホート試験における心血管イベント減少の違いとなると.観察試験と無作為化比較試験との間の効果の差異は,ホルモン補充療法の差ではないかとの議論も起きた (23).しかしホルモン補充療法の記録されたものとは異なり,我々の所見は研究デザインと様々なユーザー層とを超えて一貫していた.抗 TNF α 製剤と心血管イベント発生減少との関連性はヘルスケア分配構造の異なる国家を超えて一貫していた (15, 24).その効果はまた社会経済的階層を超えて一貫しており,メディケイドを受けるような患者でも抗 TNF α 治療で同じ利益を得ているように見えた (19).その効果は年齢を超えて一貫しており,若年患者や高齢患者いずれにおいてもイベント発生を減少させていた (14, 16).最後になるが,我々の累積解析において証明されたように,我々のコホート試験が出版された時期を超えて一貫していた.抗 TNF α 治療がもっと広範囲に処方され,もっと患者集団に拡大することで,我々はその製剤の使用と心血管イベント発生減少との関連を観察し続けた.

 我々のレビューは潜在的に心血管イベントリスクを減少させる原因となる機序を同定していない.疾病管理自体を改善させたり炎症パラメーターを改善させたりしてでも,結果として潜在的に心毒性のある薬物,例えば抗炎症性薬物や副腎皮質ホルモンなど,の使用を減少させている.あるいは抗 TNF α 製剤の直接の効果であって,抗 TNF α 製剤による動脈硬化や炎症の代理マーカーの改善を見ているのかもしれないと基礎科学研究の文脈の中で考慮されるべきである.抗 TNF α 治療は CRP の減少と相関しており,CRP は心血管疾患の独立危険因子として知られている (25, 26).強直性脊椎炎や他の炎症性疾患の治療は,3ヶ月間の治療後の脂質組成においてエタネルセプトが考慮すべき改善を証明した (27).血管生物学的研究を通じて Gonzalez-Juanatey とその研究者たちは内皮機能の改善を証明した.それには抗 TNF α を含む生物学的製剤を投与された患者の flow-mediated dilatation または carotid intima-media thickness を測定した (28, 29).European League Against Rheumatism の最近の推奨では炎症性関節炎に対する早期の積極的治療を強調しており,心血管リスクを2つの経路で低下させる目的で抗 TNF α 製剤とメソトレキセートを使用することを推奨している (30).1番目の経路とは抗 TNF α 製剤で炎症を減少させることによる直接効果であり,2番目は関節炎と関節機能を改善することで身体活動性が向上し,その後他の心血管リスク因子,例えば糖尿病や高血圧など,を減少させることになる.

 我々の研究には,コホートはそれぞれの治療群に割り付けられ,所定の治療法を受けていると仮定しているという限界がある.DMARDs や何の製剤の治療を受けている患者の割合を考慮した情報が利用できない.我々は次の前提を置くしかなかった,両治療群共に同じく寛解をゴールとして治療を受けていると.我々は抗 TNF α 単独治療群とそれに DMARDs を併用した群とを比較した解析ができなかった.というのはその情報が文献からは提供されなかったためである.メタ回帰分析も出来なかった,重要な併存疾患と心血管リスク因子の情報が限定されていたからである.コホート試験もまた関心のある転帰のモデリングのため統計的に調整を変化させた.コホート試験の結果のメタ解析は限定的で著明に異質であることをも我々は認めた.少なくとも一部では,巨大なサンプルサイズが異質検定には過剰であることを説明しうる.それぞれの研究の効果量の visual inspection は一貫して抗 TNF α 治療でイベントが減少したことを証明しており,故にメタ解析は効果が均一な方向と判断されたと考えられている.

 抗 TNF α による無作為化比較試験に関する限界は,抗 TNF α 治療による短期治療効果を第 1 に実施しており,副作用は secondary end point となっていることによる.無作為化比較試験は高度に選択された集団からなり,心血管イベントリスクが低いように見える.無作為化比較試験を我々の研究に含めた利点は,副作用が厳しい基準で判定される点にあり,転帰の提供が確実であることであった.それらはまた抗 TNF α 治療と標準的な DMARDs 治療との効果を直接比較することを可能にした.

 我々のレビュー所見についての最後の注意点として,certolizmab が我々の研究では考慮されていないことである.Certolizmab は承認されたばかりであり,我々のレビュー開始時には臨床現場に広がり始めたばかりであり,我々の検索方法には先験的に含まれていなかった.我々の適合基準に合致する certolizmab の研究は1つだけであり (31),この報告には我々のメタ解析にインパクトを与える結果はなかった.

 要約すると,我々は次のことを同定した,抗 TNF α 製剤による関節リウマチの治療は心血管イベントリスク減少に関連しているようで,その所見は明らかな生物学的なもっともらしさを支持している.我々は,リウマチにおける抗 TNF α 製剤の利益の更なる観察に努めた,特に無作為化比較試験とコホートの両者においてより長期間観察したものを.より長期間観察すれば,心血管イベント減少効果をより顕著に観察でき,抗 TNF α 治療を現在受けている患者は相対的に若く,数年後に心血管疾患に罹患することはなくなるかも知れない.潜在的な共同設立者がより詳細な情報を提供する研究により,この文献本体により高い価値を付加することになるだろう.

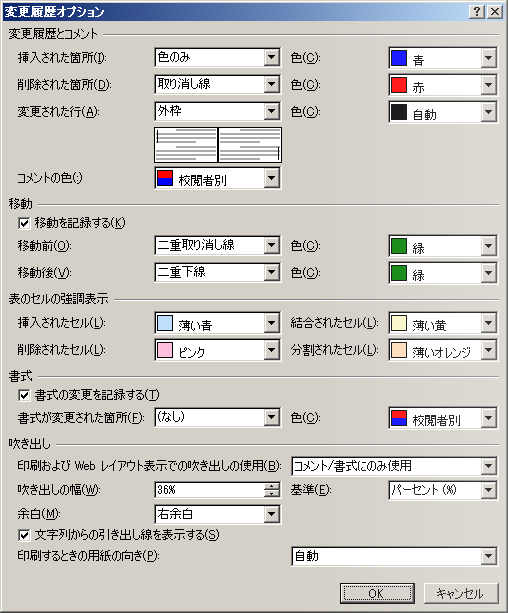
How to validate password with regular expression which requires single-byte alphanumeric characters and symbols?

It’s needed to enter password which requires a character, a number and a symbol at least, respectively. I’d like to describe how to validate password with VBScript®. It’s assumed that the length of password is 8 or greater.

EnterPassword

In 23 line, the constraint is shown. In 22 line with comment, it’s shown that constrains password to require both a single-byte character and number at least and 8 or greater character length.

Option Explicit

Private Sub CommandButton1_Click()
    With TextBox1
        If Not CheckPassword(.Text) Then
            .SetFocus
            .SelStart = 0
            .SelLength = Len(.Text)
            Exit Sub
        Else
            
        End If
    End With
    Unload Me
End Sub

Function CheckPassword(InputString As String) As Boolean
    Dim myReg   As Object
    CheckPassword = False
    Set myReg = CreateObject("VBScript.RegExp")
    With myReg
       '.Pattern = "(?!^[0-9]*$)(?!^[a-zA-Z]*$)^([a-zA-Z0-9]{8,})$"
        .Pattern = "(?!^[0-9]*$)(?!^[a-zA-Z]*$)(?!^[!-/:-@[-`{-~]*$)(?!^[a-zA-Z0-9]*$)(?!^[!-@[-`{-~]*$)(?!^[!-/:-~]*$)^([!-~]{8,})$"
        .IgnoreCase = False
        .Global = True
    End With
    If myReg.Test(InputString) Then
        CheckPassword = True
    End If
    Set myReg = Nothing
End Function

Private Sub UserForm_Initialize()
    With TextBox1
        .IMEMode = fmIMEModeDisable
        .PasswordChar = "*"
    End With
End Sub

You might need description here. The pattern (?!pattern) means such negative lookahead as EXCEPT operator effects in SQL. To seek area three circles overlap, it’s needed to remove areas around. After filtering out not required patterns with negative lookahead, it validates length of the password. The number of required pattern, which verifies n types of letter, is 2n – 2.

Not Needed Negative Lookahead Pattern
Number (?!^[0-9]*$)
Character (?!^[a-zA-Z]*$)
Symbol (?!^[!-/:-@[-`{-~]*$)
Character and number (?!^[a-zA-Z0-9]*$)
Number and symbol (?!^[!-@[-`{-~]*$)
Character and symbol (?!^[!-/:-~]*$)

PasswordValidation

References:
Regular Expression Language – Quick Reference
How To: Use Regular Expressions to Constrain Input in ASP.NET
ASCII character code list (0-127)
Userform of Excel VBA as user interface

VBScriptの正規表現でパスワードに半角英数字と半角記号が使用されているか検証する

 パスワード設定の際に半角数字,半角英字,半角記号をそれぞれ最低でも 1 文字使用するよう求められるケースは多いと思います.今回は VBScript の正規表現を用いてパスワードをチェックする方法を紹介します.

 制約条件を半角英数字,半角記号を最低でも 1 文字用いることとし,文字列長を 8 文字以上とします.下図のようにユーザーフォーム上にラベルとテキストボックスとコマンドボタンを配置します.それぞれ Label1, TextBox1, CommandButton1 とします.

EnterPassword

 下記コードの 23 行目で制約条件を表現します.コメントアウトした 22 行目は半角英数字のみを 8 文字以上用いる場合の正規表現です.文字クラス内でエスケープが必要なメタ文字は \ と ] の 2 種類です.

Option Explicit

Private Sub CommandButton1_Click()
    With TextBox1
        If Not CheckPassword(.Text) Then
            .SetFocus
            .SelStart = 0
            .SelLength = Len(.Text)
            Exit Sub
        Else
            
        End If
    End With
    Unload Me
End Sub

Function CheckPassword(InputString As String) As Boolean
    Dim myReg   As Object
    CheckPassword = False
    Set myReg = CreateObject("VBScript.RegExp")
    With myReg
       '.Pattern = "(?!^[0-9]*$)(?!^[a-zA-Z]*$)^([a-zA-Z0-9]{8,})$"
        .Pattern = "(?!^[0-9]*$)(?!^[a-zA-Z]*$)(?!^[!-/:-@[-`{-~]*$)(?!^[a-zA-Z0-9]*$)(?!^[!-@[-`{-~]*$)(?!^[!-/:-~]*$)^([!-~]{8,})$"
        .IgnoreCase = False
        .Global = True
    End With
    If myReg.Test(InputString) Then
        CheckPassword = True
    End If
    Set myReg = Nothing
End Function

Private Sub UserForm_Initialize()
    With TextBox1
        .IMEMode = fmIMEModeDisable
        .PasswordChar = "*"
    End With
End Sub

 ここで解説が必要かと思います.(?!pattern) は否定先読みを示し,SQL で言うところの EXCEPT 演算子と同じ働きをします.半角英数字と半角記号を最低でも 1 文字以上使用するとは,下表の文字の組み合わせを許可しないということです.下図の 3 つの円の重なる領域を求めるには,その周辺の領域を引き算して求めます.許可しないパターンを否定先読みで予めフィルタリングしておき,最後に全種類の文字クラスの文字列長をチェックしています.集合論とも考え方の重なる領域です.ちなみに,n 種類の文字種を検証するのに必要な否定先読みのパターン数は 2n – 2 です.

Not Needed Negative Lookahead Pattern
Number (?!^[0-9]*$)
Character (?!^[a-zA-Z]*$)
Symbol (?!^[!-/:-@[-`{-~]*$)
Character and number (?!^[a-zA-Z0-9]*$)
Number and symbol (?!^[!-@[-`{-~]*$)
Character and symbol (?!^[!-/:-~]*$)

PasswordValidation

参照:
ASP.NET への入力を制約するために正規表現を使用する方法
正規表現の構文
ASCII文字コード(0-127)一覧表
インターフェースとしてのEXCEL VBAによるユーザーフォーム

ASCII character code list (0-127)

I’d like to describe ASCII character code. Please refer to this article when you configure string pattern of regular expression. The code number 8, 9, 10 and 13 are control character, which are used as back space, tab, line feed and carriage return, respectively.

Character class of alphanumeric character is expressed as [a-zA-Z0-9] in regular expression, single-byte symbol class is expressed as [!-/:-@[-`{-~]. In character class, ] and \ character need to escape.

Code Character Meta character
0  
1  
2  
3  
4  
5  
6  
7  
8 *1
9 *2
10 *3
11  
12  
13 *4
14  
15  
16  
17  
18  
19  
20  
21  
22  
23  
24  
25  
26  
27  
28  
29  
30
31  
32 [space] 
33
34 ” 
35
36
37
38
39 ‘ 
40
41
42
43
44
45 – 
46
47
48
49
50
51
52
53
54
55
56
57
58
59
60
61
62
63
64
65
66
67
68
69
70
71
72
73
74
75
76
77
78
79
80
81
82
83
84
85
86
87
88
89
90
91
92
93
94
95
96
97
98
99
100
101
102
103
104
105
106
107
108
109
110
111
112
113
114
115
116
117
118
119
120
121
122
123
124
125
126
127  

Reference:
ASCII (Wikipedia)