Dietary Fiber and Risk of Coronary Heart Disease

This article has reported the association between dietary fiber intakes and the risk of cardiovascular disease, that it has been shown that total fiber intakes, cereal fiber intakes and fruit fiber intakes have inverse association, in contrast, vegetable fiber has no association.

In the Dietary Reference Intakes for Japanese 2015 edition, they have described “If they would intake 24 g/d or greater of dietary fiber, they could avoid the risk of coronary death.”, but I couldn’t find the describe in the original article.

Dietary Fiber and Risk of Coronary Heart Disease

A pooled Analysis of Cohort Studies

Mark A. Pereira, PhD; Eilis O’Reilly, MSc; Katarina Augustsson, PhD; Gary E. Fraser, MBChB, PhD; Uri Goldbourt, PhD; Berit L. Heitmann, PhD; Goran Hallmans, MD, PhD; Paul Knekt, PhD; Simin Liu, MD, ScD; Pirjo Pietinen, DSc; Donna Spiegelman, ScD; June Stevens, MS, PhD; Jarmo Virtamo, MD; Walter C. Willett, MD; Alberto Ascherio, MD

Background Few epidemiologic studies of dietary fiber intake and risk of coronary heart disease have compared fiber types (cereal, fruit, and vegetable) or included sex-specific results. The purpose of this study was to conduct a pooled analysis of dietary fiber and its subtypes and risk of coronary heart disease.

Methods We analyzed the original data from 10 prospective cohort studies from the United States and Europe to estimate the association between dietary fiber intake and the risk of coronary heart disease.

Results Over 6 to 10 years of follow-up, 5249 incident total coronary cases and 2011 coronary deaths occurred among 91 058 men and 245 186 women. After adjustment for demographics, body mass index, and lifestyle factors, each 10-g/d increment of energy-adjusted and measurement error–corrected total dietary fiber was associated with a 14% (relative risk [RR], 0.86; 95% confidence interval [CI], 0.78-0.96) decrease in risk of all coronary events and a 27% (RR, 0.73; 95% CI, 0.61-0.87) decrease in risk of coronary death. For cereal, fruit, and vegetable fiber intake (not error corrected), RRs corresponding to 10-g/d increments were 0.90 (95% CI, 0.77-1.07), 0.84 (95% CI, 0.70-0.99), and 1.00 (95% CI, 0.88-1.13), respectively, for all coronary events and 0.75 (95% CI, 0.63-0.91), 0.70 (95% CI, 0.55-0.89), and 1.00 (95% CI, 0.82-1.23), respectively, for deaths. Results were similar for men and women.

Conclusion Consumption of dietary fiber from cereals and fruits is inversely associated with risk of coronary heart disease.

Arch Inern Med. 2004; 164: 370-376


The Dietary Reference Intakes for Japanese (2015 edition) Carbohydrate (pdf)
The Dietary Reference Intakes for Japanese (2010 edition) Carbohydrate (pdf)

Dietary Fiber and Risk of Coronary Heart Disease

 食物繊維摂取量と心血管疾患リスクの関係を調査したプール解析の報告です.食物繊維総量,穀物繊維,果実繊維については負の相関が見られましたが野菜繊維については有意ではありませんでした.

 ところで,この文献を参照した日本人の食事摂取基準 2015 年版では『1 日 24 g 以上の繊維摂取で心筋梗塞死亡率が低下する』と述べていましたが本文にはそのような記述はありませんでした.

Dietary Fiber and Risk of Coronary Heart Disease

A pooled Analysis of Cohort Studies

Mark A. Pereira, PhD; Eilis O’Reilly, MSc; Katarina Augustsson, PhD; Gary E. Fraser, MBChB, PhD; Uri Goldbourt, PhD; Berit L. Heitmann, PhD; Goran Hallmans, MD, PhD; Paul Knekt, PhD; Simin Liu, MD, ScD; Pirjo Pietinen, DSc; Donna Spiegelman, ScD; June Stevens, MS, PhD; Jarmo Virtamo, MD; Walter C. Willett, MD; Alberto Ascherio, MD

要約

背景:食物繊維摂取量と心血管疾患リスクを比較した研究はこれまで殆どなく,食物繊維の種類(穀物,果実または野菜)の比較や性に特異的な結果を含むものに留まっていた.本試験の目的は食物繊維とその種類と心血管疾患リスクとのプール解析を行うことであった.

方法:我々は米国とヨーロッパの前向きコホート試験10件のオリジナルデータを解析し,食物繊維摂取量と心血管疾患の関連を推定した.

結果:91,058 名の男性および 245,186 名の女性を 6 から 10 年以上の期間経過観察し,5,249 件の冠動脈症例,2,011 名の冠動脈疾患死亡が発生した.人口学的因子,体格指数,生活スタイル因子での調整後では,エネルギー調整および食物繊維総量の測定誤差に関して 10 g/day 増加するごとに全心血管イベントの 14 % 減少と相関しており,相対リスクは 0.86, 95 % 信頼区間は0.78-0.96 であった.また冠動脈疾患死亡の 27 % 減少と相関しており相対リスクは 0.73, 95 % 信頼区間は 0.61-0.87 であった.穀物,果実,野菜の食物繊維摂取量と全心血管疾患イベント発生との関連においては,10 g/day 増加ごとにそれぞれ相対リスク 0.90, 95 % 信頼区間 0.77-1.07, 相対リスク 0.84, 95 % 信頼区間 0.70-0.99, 相対リスク 1.00, 95 % 信頼区間 0.88-1.13 であった.また死亡との関連では相対リスク 0.75, 95 % 信頼区間 0.63-0.91, 相対リスク 0.70, 95 % 信頼区間 0.55-0.89, 相対リスク 1.00, 95 % 信頼区間 0.82-1.23 であった.男女とも結果はよく似ていた.

結論:穀物,果実および野菜の食物繊維の消費は心血管疾患リスクと負の相関が見られる.

Arch Inern Med. 2004; 164: 370-376

 食物繊維は様々な機序を通じて,すなわち血清脂質組成の改善,降圧作用並びにインスリン感受性と線溶系活性とを改善することで心血管疾患リスクを減少させているのかもしれない.いくつかの観察研究において食物繊維が心血管疾患のリスク因子と負の相関を示すことが分かってきた.

 最低 10 件の前向きコホート試験で食物繊維と心血管疾患発生との関係を精査した.それらの試験のうち一つを除いて全て負の相関を報告していた.方法および解析技術の相違により繊維摂取総量および繊維の種類(由来が穀物か果実か野菜かおよび水溶性か否か)のこの相関の強度は不明のままであった.更に,4編のみの試験では男性を除外して女性における所見を報告していた.他の生活スタイル因子によるネガティブな刊行バイアスおよび残差交絡の可能性が残っている.ゆえに我々は米国およびヨーロッパにおける 10 件の前向きコホート試験から系統的解析を行った.それには Pooling Project of Cohort Studies on Diet and Coronary Disease を含んでいた.

方法

 このプール解析には下記の適合基準を適用した.すなわち,最低 150 例の冠動脈疾患発症例を有する前向き試験,日常の食事摂取の評価,および食事評価法の検証試験またはそれに近い関連する機器.文献検索およびその道の専門家への質問を通じて 14 の試験が適合基準に合致するとして同定され,11 試験の研究者がプロジェクトにおけるデータの提供に賛同した.1 編の試験は食物繊維摂取量のデータを有していないため除外された.利用できる 3 編の試験の研究者は,皆米国からの報告だったのだが,試験への参加に賛同しなかった.残った試験を Table 1 に示す.Nurses’ Health Study (NHS) の経験の解析のための観察期間は,食事摂取を繰り返し評価していることと長期間の観察期間という利点から2つの期間に分割した.1980-1986 年の観察期間は Nurses’ Health Study A (NHSa) と呼ばれ,1986 年まで心血管疾患を発症しなかった女性の 1986-1996 年の観察期間は Nurses’ Health Study B (NHSb) と呼ばれた.生存期間の underlying theory に基づき,異なる期間における人-期間のブロックは,同じ人に由来したとしても統計的に独立であった.ゆえに,これらの2つの期間からのプール推定値は一つの期間を用いたのと等価であり,1980 年と比較して 1986 年における強化された曝露評価における利点を有している.

食事評価

 いずれの試験においても食物摂取頻度アンケートまたは食事履歴計器によるベースラインの食事を計測していた.Adventist Health Study (AHS) においては原食物繊維だけを評価していた.そのため,このコホートにおいては食物繊維総量の近似のため原食物繊維に 3.5 を掛け算した.これは他の試験から得られた原食物繊維の食物繊維総量に対する比である.食物繊維総量に加え,我々は 3 つの食品群からの繊維摂取量を調査した.それには穀物(全粒穀物),果実および野菜が含まれ,不溶性食物繊維(ヘミセルロース,セルロースおよびリグニン)および水溶性食物繊維(ペクチン,ガム質および粘液質)も含まれる.穀物,果実および野菜由来の繊維は AHS および Glostrup Population Study (GPS) 以外のすべての試験で利用可能であった.広い種類の食品が各々の繊維の種類に寄与しており,ある種の食物は多くの試験において相対的に寄与していた.トウモロコシやエンドウなどのでんぷん質の野菜はすべての試験において野菜の繊維に実質的に寄与していた.Finish Mobile Clinic Health Examination Survey (FMC) および Vasterbotten Intervention Program (VIP) のみがバレイショの繊維を野菜の繊維に含めており,これら 2 編の試験においてはバレイショの繊維は野菜の繊維の一般的形態であった.6 編の試験のみが不溶性食物繊維および水溶性食物繊維の推定値を有していたが,食品成分表に基づいてこれらの繊維の種類を推定する標準的方法がなかったため,結果の解釈は注意深くあるべきである.

症例確認

標準化基準を用いて全ての試験における致死的または非致死的心筋梗塞症例の確認を行った.IWHS のみが心血管疾患発症において自己申告データであったため,この試験からは致死的心筋梗塞症例のみを抽出した.我々は全ての致死性および非致死性冠動脈イベントおよび冠動脈疾患死について個別分析を行った.

統計解析

 ベースライン人口のエネルギー摂取量の平均値を対数変換した研究特異的な 3SD より大又は小のエネルギー摂取量を報告した場合には約 1 % の参加者を各試験から除外した.臨床的な疾患の出現自体が食事変化をもたらす可能性があるため,我々はまたベースラインにおいて心血管疾患や糖尿病,癌(黒色腫でない皮膚がんを除く)の既往のある参加者も除外した.ARIC, FMC, GPS および IWHS の 4 試験では10 年より長い観察期間は試験期間中の異質性を減らすために切り捨てられた.それぞれのコホート内で繊維の増加ごとの相対リスク (RRs)(発症率の比)を比例ハザード回帰モデルを用いて計算した.SAS 統計ソフトバージョン 8 の PRC PHREG プログラムで計算した.相対リスクは関連するベースライン人口,生活スタイルおよび食事因子で調整した.共変量のカテゴリーは若干の例外はあるものの試験の間で標準化した.既往歴については試験の間の情報は次のいくつかまたは全てを含んでいる.すなわち,疾患の自己申告,内服薬の使用または生体計測(例,血圧と血清コレステロール値など).身体活動については試験の間の情報は,低い・中等度・高い余暇活動の単純なカテゴリーから総身体活動の連続値の代謝指数にまで渡り,代謝指数は 5 群に分類された. 1 編の試験では身体活動は利用できなかった.2 編の試験ではアルコール摂取が利用できなかった.三つの回帰モデルで次のように計算した.モデル 1 は年齢(歳),エネルギー摂取量(1日あたりのキロカロリー),喫煙状態(一度も喫煙したことがない,かつて喫煙していた,または現在喫煙しておりその本数が 1 日 1-4, 5-14, 15-24, 25 本以上),体格指数 (<23, 23-<25, 25-<27.5, 27.5-<30, 30-), 身体活動(レベル 1-5),学歴(高校未満,高校,大学以上),アルコール摂取量 (0, <5, 5-<10, 10-<15, 15-<30, 30-<50, 50- mL/d), 複合ビタミン剤服用(はい,いいえ),高コレステロール血症(はい,いいえ)そして高血圧(はい,いいえ).モデル 2 はモデル 1 の共変量を含み,さらにエネルギーで調整した飽和脂肪酸の五分位数,多価不飽和脂肪酸,そしてコレステロール.モデル 3 はモデル 2 の共変量を含み,さらにエネルギーで調整した葉酸およびビタミン E サプリメントの五分位数.

 両側 95 % 信頼区間を計算した.我々は DerSimonian および Laird により開発されたランダム効果モデルを採用し Log RRs を結合した.つまり試験特異的相対リスクをその分散の合計の逆数で重み付けしたものである.我々は試験間の分散要素 Q 統計値の推定値を用いて試験間の異質性をテストした.

 回帰分析を実行する前に,食物繊維およびすべての食事の共変量をエネルギー摂取量について各試験内で調整した.我々はエネルギーで調整した食物繊維を連続変数として解析した(10 g/d ごとの増分).我々はまた五分位数および十分位数もまた調べ,コホート特異的な分布に基づき,相関が線形で連続値の繊維の解析について一貫性のあるものかを定義した.食物繊維摂取量の境界値の絶対値を用いて,すべての試験について可能な範囲で全ての食物繊維摂取量にわたって我々はまた心血管疾患のリスクを調べた.五分位間での傾向の検定に P 値を計算するため,参加者は五分位数の食物繊維摂取量の中央値を割り付けられ,この値は Cox 回帰モデルの連続項として入力された.連続値としての食物繊維摂取量の結果は食事測定誤差によるバイアスを補正され,繊維単独においては,回帰補正法を用いた.この補正は特異的な食物源からの繊維摂取量には実行できなかった.というのは繊維のこれらの源を含む検証試験が殆どなされていなかったからである.他の共変量およびそのモデルにおける食事因子への測定誤差補正はなされなかった.

 我々は以下の共変量が繊維摂取量と心血管疾患リスクの関係を修飾するか否かを評価した.すなわち,性別,年齢(10歳ごとのカテゴリー),観察期間,体格指数 (<25, 25-30, >30), 喫煙(全く吸わない vs 以前喫煙歴ありまたは現在喫煙している),飽和脂肪酸摂取量(エネルギー摂取量中のパーセンテージ五分位数),そして高血圧ならびに高脂血症の既往(陽性又は陰性).関心のある各因子ごとに,各因子のレベルの点数および連続値として表現される繊維摂取量との直積項を各多変量モデルに含めた.試験特異的交互作用係数をプールし,プールした交互作用項の標準誤差の自乗で割ることで結果として得られる自由度 1 のカイ二乗分布を参照して, Wald 統計値の自乗を用いて効果修飾の検定のプールした P 値を得た.いかなる統計的有意な年齢または観察期間の効果修飾の欠如も比例ハザード仮定を支持する.

結果

 総計 91,058 名の男性および 245,186 名の女性,2,506,581 人年の観察期間の貢献が解析に含まれた.イベント総数は 5,249 件であり 2,011 名の致死症例があった (Table 1). 各コホートごとの繊維摂取量の中央値は Table 1 に示した.

 全ての主要な致死性・非致死性冠動脈イベントおよび冠動脈死の相対リスクを,エネルギー調整した繊維摂取総量の 10 g/d の増分ごとに Table 2 に示した.全ての人口学的および非食事性生活スタイル因子で調整した解析では,食物繊維摂取量が 10 g/d 増えるごとに,全冠動脈イベントの 12 % のリスク減少および冠動脈死の 19 % 減少を観察した.これらのプール推定値は,食事性の脂肪酸摂取量,モデル 2 における食事性コレステロール摂取量およびモデル 3 における葉酸とビタミン E の食事並びにサプリメントからの摂取量で調整しても,ごくわずかの減衰しか認めなかった.これらの相関は男性および女性において近似しており,冠動脈死の相対リスクおよび 95 % 信頼区間はそれぞれ 0.82 (0.72-0.94), 0.80 (0.66-0.96) であった.さらに α および β カロテン,n-3 系脂肪酸および α リノレン酸で調整しても結果に実質的な違いはなかった(データは示さない).食物繊維摂取量の五分位数の解析も同様の所見を示した.第 5 五分位数と比較して第 1 五分位数の相対リスクは全イベントで 0.90 であり傾向検定では P < 0.09 であった.冠動脈死の相対リスクは 0.70 で傾向検定では P < 0.001 であった.モデル 3 の結果は補正されたか繊維単独において測定誤差に由来するバイアスであった.10 g/d の増加ごとの相対リスクは全冠動脈イベントで 0.86 であり 95 % 信頼区間は 0.78-0.96 であった.冠動脈死では相対リスク 0.73 であり 95 % 信頼区間は 0.61-0.87 であった.

 繊維の種類による結果については Table 3 に要約してある.モデル 3 で行ったように全ての人口学的因子,生活スタイル因子,食事性因子について調整済みである.穀物の繊維 10 g/d の増加につき 10 % の冠動脈イベントのプールした相対リスク減少,果実の繊維 10 g/d の増加につき 16 % の冠動脈イベントの減少を認めたが,穀物繊維については 95 % 信頼区間が 1.00 を含んでいた.全イベントよりも冠動脈死の方がより強い相関を示した.すなわちそれぞれ 10 g/d 増加ごとに穀物繊維では 25 % のリスク減少,果実繊維では 30 % のリスク減少を示した.対照的に,野菜の繊維は冠動脈疾患発生や死亡について有意ではなかった.8 試験で穀物繊維と全冠動脈イベントとの解析において相対リスクの異質性 (P = 0.025) が観察された.この異質性は女性の 3 コホート (ARIC, NHSa, VIP) における正相関による性別の差異で説明されているように見えた.他のいかなる解析においても有意な異質性は観察されなかった.

 穀物および果実の繊維で観察された相関が独立か否かを定義するため,我々はこれらの繊維の種類を同じ回帰モデルに含めた.これらの解析の結果は全てのイベントにおいて近似しており,全イベントについて果実繊維の相対リスクは 0.81, 95 % 信頼区間は 0.69-0.95, 穀物繊維の相対リスクは 0.89, 95 % 信頼区間は 0.76-0.1.05, 死亡について果実繊維の相対リスクは 0.65, 95 % 信頼区間は 0.49-0.86, 穀物繊維の相対リスクは 0.71, 95 % 信頼区間は 0.59-0.87 であった.これは穀物と果実の繊維がそれぞれ独立であることを示唆していた.我々はまた水溶性食物繊維および不溶性食物繊維と心血管疾患リスクとの関連についても調査した.両者の摂取は全ての冠動脈イベントおよび冠動脈死と逆相関していた.相対リスクに異質性は全く観察されなかった.水溶性食物繊維において相関はより強かった.全イベントについて 10 g/d 増加で相対リスクは 0.72, 95 % 信頼区間は0.55-0.93, 死亡について相対リスクは 0.46, 95 % 信頼区間は 0.28-0.74 であった.一方,不溶性食物繊維においては全イベントについて相対リスク 0.90, 95 % 信頼区間は 0.83-0.97, 死亡について相対リスクは 0.80, 95 % 信頼区間は 0.69-0.92 であった.広い信頼区間にもかかわらず,水溶性および不溶性食物繊維が同じモデルに含まれる時,結果は近似していた.

 年齢,観察期間(最初の 2 年間の除外を含むか,最初と次の 5 年間で層別化してある),体重超過の状態,喫煙および飽和脂肪酸摂取量で層別化した時,データは示さないが,食物繊維総量で測定誤差補正したその結果は一般に一貫性があった.食物繊維と他のこれらの共変量との間には有意な相互作用はなかった.

 最後に,エネルギー調整した食物繊維の境界値の絶対値による結果を Figure に示す.参照カテゴリーは 18 から 21 g/d であり Table 3 と同じ調整をしてある.

考察

 本試験の結果は以下のことを示唆している.食物繊維は男女いずれにおいても心血管疾患リスクと逆相関している.その相関は冠動脈死についてより強く,食物繊維総量 10 g/d 増加につき 27 % のリスク減少を認め,全イベントについては 14 % のリスク減少を認める.穀物繊維と果実繊維が心血管疾患リスクと強い負の相関を認めるにもかかわらず,野菜繊維にはそのような相関は全く観察されなかった.これらの相関は他の食事因子,性別,年齢,ベースライン体格指数,喫煙,高血圧の既往,糖尿病および高コレステロール血症とは独立であると考えられた.

 各研究間の相対リスクは概ね一貫していた.唯一穀物繊維と全冠動脈イベントの解析で相対リスクの異質性が観察されたのみであり,AHS, NHSa および VIP の女性の 3 コホートにおいて相対リスクが 1.00 を超えていた.NHSa においては,古いバージョンの食物摂取頻度アンケートが用いられており,繊維総量特に穀物繊維の定量にあたって限られた情報しか利用できなかった.NHSa における精製された穀物の穀物繊維への相対的寄与は誇張されているように見えたが,一方で全粒穀物においては逆のことが起きているように見えた.精製された穀物ではなく,全粒穀物は心血管疾患リスクを減少させることが示されたため,穀物繊維摂取量におけるそのような測定誤差が予期せぬ NHSa の所見を説明できるだろう.実際,以前刊行された NHS の知見は食物摂取頻度アンケートの繰り返し(1984 年,1986 年および 1990 年)における食物繊維摂取量の平均値の解析を含んでおり,その結果は強い負の相関を明らかにしており,5 g/d の穀物繊維増加ごとの相対リスクは 0.63 である.AHS および VIP の女性の所見はそれらの試験の男性のそれとは一致しなかった.さらに,これらの点推定値の信頼区間が広いため,我々はそこから有意義な推論を引き出すことができなかった.

 プールされたプロジェクトに含まれる繊維と心血管疾患との 4 編の研究の知見は既に刊行されている.NHS および HPFS においては,穀物繊維に最も強い負の相関が観察され,果実および野菜繊維でより弱い相関となった.ATBC においては,全ての種類の繊維について負の相関が概ね観察された.WHS においては Liu らにより果実繊維摂取量と全心血管疾患リスクとの間に最も強い相関が観察されたが,一方で心筋梗塞発症との相関は全く観察されなかった.食物繊維と心血管疾患との 6 編の刊行された試験はプールされたプロジェクトには含まれていなかった.というのは,最低 150 件の発症または食事評価の検証という要求に合致しなかったか,あるいは我々がその存在に気付かなかったからである.食物繊維摂取量と心血管疾患との間の統計的有意な負の相関を示した 3 編の報告のうち,2 編は統計的有意でない負の相関を報告し,1 編の試験は全く有意でない正相関を報告している.Mann らは食物繊維消費総量の増加に伴い有意でない心血管疾患リスクの増加を観察しているが,この結果は死亡が 38 例とイベント発生数が少ないため疑わしいとされている.

 野菜繊維摂取量と心血管疾患リスクとの間の負の相関を支持する結果は少ない.この結果に対する可能性のある説明の一つとして,栄養素に乏しく高血糖を負荷する一般的なでんぷん,および大きく加工された野菜,つまりトウモロコシやエンドウマメなどの性質が挙げられる.VIP および FMC の 2 編の研究はまたバレイショも野菜繊維の解析に含めていた.食事性の血糖負荷が実質的に心血管疾患と 2 型糖尿病とのリスク増加につながることが明らかになってきている.ゆえに,いかなる野菜繊維の有用な効果もでんぷん性野菜の副作用に対抗することができる.研究と公衆衛生勧告の両者において,食品の種類が研究され,推奨され,さらに(疾患リスクを)減衰させるべきである.本試験の一つの限界は,食物繊維におけるこれらの解析を補う食品データが欠損していることである.心血管疾患との関連における食品と食事パターンのプール解析は本調査の範囲を超えるものであるが,それらは将来の調査では必ず含めるべきである.

 さらなる関心事として,水溶性繊維および不溶性繊維の両者が心血管疾患からの保護をもたらすのかどうかということがある.以前の研究ではこの可能性を支持しており,繊維のいずれのクラスにも一貫した利点はなかった.本試験では両者の繊維に負の相関が観察されたが,相対リスクは水溶性繊維においてより強く,10 g/d 増加ごとの冠動脈死の相対リスクは 0.46 に至っていた.これらの結果は慎重に解釈しなければならない.というのは,たかだか 6 編の研究しか不溶性繊維および水溶性繊維について推定していないからであり,これらの推定値に由来するのに使用された標準化手法は存在しないからである.しかしながら,水溶性繊維の特徴としてこれらの所見を説明できるかもしれない.つまり小腸管腔内の粘性を増加させる傾向にあり,ゆえに栄養素および潜在的に結合する胆汁酸の吸収を緩徐にしていると.このようにインスリン分泌を減少させ,血糖コントロール,血清コレステロール値および血圧を改善させる効果が明らかにされている.にもかかわらず,水溶性繊維および不溶性繊維の両者と心血管疾患リスクが逆相関するという今回の解析における所見はあらゆる種類の食物繊維に富む食品消費量の増量を推奨することを支持している.

 プールプロジェクトの利点は,過去に陰性の刊行バイアスを疑われて刊行されなかった結果を含めていることである.そこで,プールされた結果は個々に出版された研究に比べてより真の相関に近いかもしれない.他の利点としてすべての研究に渡る解析戦略の系統的実行,モデリングの露出および一様に重要な共変量が含まれる.そのような努力は相対リスク推定値間の異質性の尤度を減少させ,ゆえにプール推定値の一般化可能性を強化することになる.ゆえに,プールプロジェクトは利用可能な観察データを最もよく使用して食事と慢性疾患についての仮定を記述するものである.食物繊維の測定誤差を補正するための検証研究からのデータを使用できることが本解析の強みであるが,我々は全ての共変量および他の食事因子の測定誤差を調整できなかったため,測定誤差補正は注意深く解釈しなければならない.他の限界として食事評価および食品成分表という手法の異質性が挙げられる.特に水溶性繊維および不溶性繊維の解析にとって,受け入れられた測定法は存在せず,6 編の研究がこれらの繊維の種類を定量したのみである.しかしながら,我々は研究の間における相対リスクで唯一統計的有意な異質性を発見し,我々の手法の限界がその知見の検証を弱体化させるものではなかったことを示唆していた.

 結論として,我々の結果は成人における食物繊維摂取量が心血管疾患リスクと負の相関を示すことを支持している.冠動脈リスクは食物繊維総量,穀物繊維,または果実繊維摂取が 10 g/d 増えるごとに 10 % から 30 % 減少していた.その結果は以前刊行されたコホート試験の結果を強く確認させることをもたらし,非常に多くの基礎研究が,広範囲の可能性のある生物学的機序を通じて,食物繊維が心血管疾患リスクを減少させる可能性があることを証明していることを支持している.ゆえに,心血管疾患を予防するために食物繊維を豊富に含む食品の摂取を推奨することは一貫した科学的根拠のある富に基づいているのである.

参照:
日本人の食事摂取基準(2015 年版)炭水化物 (pdf)
日本人の食事摂取基準(2010 年版)炭水化物 (pdf)

 長文お読みいただきありがとうございました.さて,ここからは宣伝です.皆様の主食は米でしょうか,小麦粉でしょうか.私は米です.以前は精白米を購入しておりましたが,時間が経つとやはり味が落ちます.そこで下の精米機を 5 年前に導入しました.玄米を購入し,その都度精米して炊くわけです.精製してすぐのお米はやはり美味しいです.

 この精米機はとにかく丈夫です.5 年使ってますが壊れる気配がありません.精米の程度も細かく指定できます.音はやかましいですがこれは仕方ありません.お勧めです.

n-3 Fatty Acids

N-3 fatty acids are consists of α linoleic acid derived from cooking oil, eicosapentaenoic acid (EPA), docosapentaenoic acid (DPA) and docosahexaenoic acid (DHA) derived from fish oil. Animals can not synthesize these fatty acids in their body, then the lack of n-3 fatty acids leads to dermatitis. N-3 fatty acids not only compete with n-6 fatty acids but also have its own physiological effect. Therefore, the reference intakes has been set.

Infant

The approximate amount for 0-5 months infant has been set to 0.9 g/d by multiplying the standard mammalian amount 0.78 L/d to n-3 fatty acids concentration of breast milk 1.16 g/L. The approximate amount for 6-11 months infant has been set to 0.8 g/d by calculating the average of the approximate amount of 0-5 months infant and of 1-2 years old child based on the National Health and Nutrition Survey in 2010 and 2011.

Child and Adult

The approximate amount has been set to the median of n-3 fatty acids intake based on the National Health and Nutrition Survey in 2010 and 2011.

Pregnant and Lactation

The approximate amount has been set to 1.8 g/d, the median of n-3 fatty acids intake based on the National Health and Nutrition Survey in pregnant and lactation from 20108 to 2011.

α linoleic acid

There is a report of negative correlation between α linoleic acid and cardiovascular disease, 1 g/d increase of α linoleic acid intake results 10 % decrease of cardiovascular death. However, there are not enough reports for Japanese subject, then the target amount has not been set. Although the risk of prostate cancer, negative association of egg function and negative possibility of fertility have been reported, they are not determined. The effect of long-term intake of α linoleic acid is not clear.

EPA and DHA

The results of meta analysis on the relationship between EPA and DHA and cardiovascular disease is not consisted. The reports for Japanese subject are JPHC, JACC study and JELIS. The intervention study for stroke in Japanese is JELIS, that has shown not primary prevention effect but secondary prevention. There are meta-analysis of breast cancer cohort studies and report of risk reduction in the meta-analysis of colorectal cancer cohort study. In Japanese, decrease of liver cancer incidence and risk reduced of proximal colon cancer has been reported in JPHC. The association between n-3 fatty acid and depression and dementia is not clear.

Fish include such heavy metals as mercury, cadmium, lead and tin and such toxins as PCB and dioxins. There are another criterion for these harmful substances. Therefore, the Dietary Reference Intakes does not take account into these harmful substances.

Although target amount of α-linoleic acid had been set in 2010 edition, it has not been set in 2015 edition. Although they recommended the intake of grater than 1 g/d of EPA and DHA in 2010 edition, they have not been set in 2015 edition.

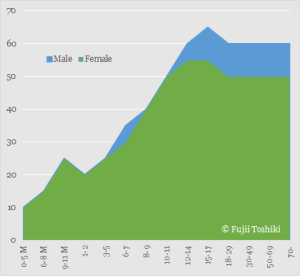
2015 edition and 2010 edition of the dietary reference of n-3 fatty acids are following table.

The Dietary Reference Intakes of n-3 fatty acids (g/d) (2015 edition)
Gender Male Female
Age Approximate Amount Approximate Amount
0-5 M 0.9 0.9
6-11 M 0.8 0.8
1-2 0.7 0.8
3-5 1.3 1.1
6-7 1.4 1.3
8-9 1.7 1.5
10-11 1.7 1.4
12-14 2.1 1.8
15-17 2.3 1.7
18-29 2.0 1.6
30-49 2.1 1.6
50-69 2.4 2.0
70- 2.2 1.9
Pregnant 1.8
Lactation 1.8
The Dietary Reference Intakes of n-3 fatty acids (g/d) (2010 edition)
Gender Male Female
Age Approximate Amount (g/d) Target Amount (% energy) Approximate Amount (g/d) Target Amount (% energy)
0-5 M 0.9 0.9
6-11 M 0.9 0.9
1-2 0.9 0.9
3-5 1.2 1.2
6-7 1.6 1.3
8-9 1.7 1.5
10-11 1.8 1.7
12-14 2.1 2.1
15-17 2.5 2.1
18-29 ≤ 2.1 ≤ 1.8
30-49 ≤ 2.2 ≤ 1.8
50-69 ≤ 2.4 ≤ 2.1
70- ≤ 2.2 ≤ 1.8
Pregnant 1.9
Lactation 1.7

References:
The Dietary Reference Intakes for Japanese (2015 edition) Lipid (pdf)
The Dietary Reference Intakes for Japanese (2010 edition) Lipid (pdf)

n-3 系脂肪酸

 n-3 系脂肪酸には食用調理油由来の α リノレン酸と魚由来のエイコサペンタエン酸 (EPA), ドコサペンタエン酸 (DPA) およびドコサヘキサエン酸 (DHA) などがあります.これらの脂肪酸は生体内で合成できず,欠乏すると皮膚炎を発症します.n-3 系脂肪酸の生理作用は n-6 系脂肪酸と競合するだけでなく独自の作用をも持つため,独自の摂取基準を設定しました.

乳児

 0-5 ヶ月児の目安量は母乳中の n-3 系脂肪酸濃度 1.16 g/L に基準哺乳量 0.78 L/d を乗じて 0.9 g/d に設定しました.6-11 ヶ月児の目安量は 0-5 ヶ月児の目安量と平成 22 年および 23 年の国民健康・栄養調査に基づく 1-2 歳児の摂取量の中央値との平均値 0.8 g/d に設定しました.

小児・成人

 平成 22 年および 23 年の国民健康・栄養調査における n-3 系脂肪酸の総摂取量の中央値を目安量に設定しました.

妊婦・授乳婦

 平成 19 年から 23 年までの国民健康・栄養調査に基づく妊婦・授乳婦の n-3 系脂肪酸摂取量の中央値 1.8 g/d を目安量に設定しました.

α リノレン酸

 α リノレン酸と心血管疾患との間には弱い負の相関が報告されており,1 g/d のα リノレン酸摂取量の増加は心筋梗塞による脂肪を 10 % 減少させます.しかし日本人を対象とした十分な研究がないため,目標量は設定しませんでした.その他,前立腺がんのリスク,卵子機能との負の関連および妊娠可能性の低下の可能性など指摘されていますがいずれも確定したものではなく,α リノレン酸多量摂取の長期間の影響は分かっていません.

EPA および DHA

 EPA および DHA と冠動脈疾患との関連についてのメタ解析の結果は一致していません.日本人を対象とした研究には JPHC, JACC 研究JELIS などがあります.日本人における脳卒中への介入試験には JELIS があり,一次予防効果はなく二次予防効果のみ認められています.乳がんコホート研究のメタ解析結腸直腸がんコホート研究のメタ解析でのリスク減少の報告があります.日本人では JPHC 研究において近位大腸がんのリスク減少および肝がん罹患の減少が報告されています.認知症やうつ病については n-3 系脂肪酸との関連は分かっていません.

 魚には水銀,カドミウム,鉛やスズなどの重金属,PCB やダイオキシンなどの有害物質も含まれ,これらの有害物質については別の基準があります.そのため食事摂取基準では有害物質については考慮していません.

 n-3 系脂肪酸のうち α リノレン酸については 2010 年版では目標量が設定されていましたが 2015 年版では目標量は設定されていません.また EPA および DHA については 2010 年版では 18 歳以上において 1g/d 以上の摂取を推奨していましたが,2015 年版では目標量は設定されていません.

 n-3 系脂肪酸の食事摂取基準の 2015 年版および 2010 年版は下表のとおりです.

n-3 系脂肪酸の食事摂取基準 (g/d) (2015 年版)
性別 男性 女性
年齢 目安量 目安量
0-5 M 0.9 0.9
6-11 M 0.8 0.8
1-2 0.7 0.8
3-5 1.3 1.1
6-7 1.4 1.3
8-9 1.7 1.5
10-11 1.7 1.4
12-14 2.1 1.8
15-17 2.3 1.7
18-29 2.0 1.6
30-49 2.1 1.6
50-69 2.4 2.0
70- 2.2 1.9
妊婦 1.8
授乳婦 1.8
n-3 系脂肪酸の食事摂取基準 (2010 年版)
性別 男性 女性
年齢 目安量 (g/d) 目標量 (% energy) 目安量 (g/d) 目標量 (% energy)
0-5 M 0.9 0.9
6-11 M 0.9 0.9
1-2 0.9 0.9
3-5 1.2 1.2
6-7 1.6 1.3
8-9 1.7 1.5
10-11 1.8 1.7
12-14 2.1 2.1
15-17 2.5 2.1
18-29 ≤ 2.1 ≤ 1.8
30-49 ≤ 2.2 ≤ 1.8
50-69 ≤ 2.4 ≤ 2.1
70- ≤ 2.2 ≤ 1.8
妊婦 1.9
授乳婦 1.7

参照:
日本人の食事摂取基準(2015 年版)脂質 (pdf)
日本人の食事摂取基準(2010 年版)脂質 (pdf)

n-6 Fatty Acids

98% of the n-6 fatty acids that Japanese intake is linoleic acid. The organism can not synthesize n-6 fatty acids. Therefore, they must orally intake them. According to the National Health and Nutrition Survey in 2010 and 2011, the median of the n-6 fatty acids intake of Japanese were 10.0 g/d (4.3 %E) in male and 8.4 g/d (4.6 %E) in female, respectively. There are no reports required to set the Estimated Average Requirement for healthy people or no reports of dermatitis due to lack of n-6 fatty acids in usual diet, the approximate amount has been set.

Infant

The approximate amount for 0-5 months infant has been set to 4.0 g/d by multiplying the standard mammalian amount 0.78 L/d to n-6 fatty acids concentration of breast milk 5.16 g/L. The approximate amount for 6-11 months infant has been set to 4.3 g/d by calculating the average of the approximate amount of 0-5 months infant and of 1-2 years old child.

Adults and Child

The approximate amount has been set to the median of n-6 fatty acids intake based on the National Health and Nutrition Survey in 2010 and 2011.

Pregnant and Lactation

The approximate amount for pregnant has been set to 9 g/d based on the median n-6 fatty acids intake in pregnant in the National Health and Nutrition Survey from 2007 to 2011. The approximate amount for lactation has also been set to 9 g/d based on the median n-6 fatty acids intake in lactation.

It is not fully understood of the risk of linoleic acid that it is ingested in large amounts because it is easily oxidized than such monounsaturated fatty acids as oleic acid. And it is concerned of the safety of high intakes of linoleic acid because linoleic acid generate such inflammation including substance as prostaglandins and leukotrienes. Although the risk of overdose has been assumed for n-6 fatty acids, the approximate amount has not been set because there are no reports for Japanese subject.

The Dietary Reference Intakes of n-6 fatty acids in 2015 edition and 2010 edition are following table.

The Dietary reference Intakes of n-6 fatty acids (g/d) (2015 edition)
Gender Male Female
Age Approximate amount Approximate amount
0-5 M 4 4
6-11 M 4 4
1-2 5 5
3-5 7 6
6-7 7 7
8-9 9 7
10-11 9 8
12-14 12 10
15-17 13 10
18-29 11 8
30-49 10 8
50-69 10 8
70- 8 7
Pregnant 9
Lactation 9
The Dietary Reference Intakes of n-6 fatty acids (2010 edition)
Gender Male Female
Age Approximate (g/d) Target (% energy) Approximate (g/d) Target (% energy)
0-5 M 4 4
6-11 M 5 5
1-2 5 5
3-5 7 6
6-7 8 7
8-9 9 8
10-11 10 9
12-14 11 10
15-17 13 11
18-29 11 < 10 9 < 10
30-49 10 < 10 9 < 10
50-69 10 < 10 8 < 10
70- 8 < 10 7 < 10
Addition for Pregnant + 1
Addition for Lactation + 0

References:
The Dietary reference Intakes for Japanese (2015 edition) Lipid (pdf)
THe Dietary reference Intakes for Japanese (2010 edition) Lipid (pdf)

n-6 系脂肪酸

 日本人が摂取する n-6 系脂肪酸の 98 % はリノール酸です.生体は n-6 系脂肪酸を合成できないため経口摂取する必要があります.平成 22 年および 23 年の国民健康・栄養著差によると,日本人の n-6 系脂肪酸摂取量の中央値は男性 10.0 g/d (4.3 %E), 女性 8.4 g/d (4.6 %E) です.健康な人の推定平均必要量の設定に必要な報告はなく,日常生活で n-6 系脂肪酸の欠乏による皮膚炎の報告はないため,目安量を設定しました.

乳児

 0-5 ヶ月児については母乳中の n-6 系脂肪酸濃度 5.16 g/L に基準哺乳量 0.78 L/d を乗じて4.0 g/d を目安量としました.6-11 ヶ月児については 0-5 ヶ月児の目安量と 1-2 歳児の目安量の平均を求め,4.3 g/d を目安量に設定しました.

小児・成人

 平成 22 年および 23 年の国民健康・栄養調査から算出した n-6 系脂肪酸摂取量の中央値を目安量に設定しました.

妊婦・授乳婦

 平成 19 年から 23 年までの国民健康・栄養調査から算出した妊婦の n-6 系脂肪酸摂取量の中央値は 9 g/d であり,これを目安量に設定しました.同様に授乳婦の n-6 系脂肪酸摂取量の中央値は 9 g/d であり,これを目安量に設定しました.

 リノール酸は一価不飽和脂肪酸のオレイン酸より酸化されやすく多量に摂取した際のリスクは十分に分かっていません.またリノール酸は炎症惹起物質のプロスタグランジンやロイコトリエンを生成するため,多量摂取時の安全性が危惧されます.n-6 系脂肪酸については過剰摂取のリスクが想定されていますが,日本人を対象とした報告がないため目標量は設定されていません.

 n-6 系脂肪酸の食事摂取基準の 2015 年版および 2010 年版は下表のとおりです.

n-6 系脂肪酸の食事摂取基準 (g/d) (2015 年版)
性別 男性 女性
年齢 目安量 目安量
0-5 M 4 4
6-11 M 4 4
1-2 5 5
3-5 7 6
6-7 7 7
8-9 9 7
10-11 9 8
12-14 12 10
15-17 13 10
18-29 11 8
30-49 10 8
50-69 10 8
70- 8 7
妊婦 9
授乳婦 9
n-6 系脂肪酸の食事摂取基準 (2010 年版)
性別 男性 女性
年齢 目安量 (g/d) 目標量 (% energy) 目安量 (g/d) 目標量 (% energy)
0-5 M 4 4
6-11 M 5 5
1-2 5 5
3-5 7 6
6-7 8 7
8-9 9 8
10-11 10 9
12-14 11 10
15-17 13 11
18-29 11 < 10 9 < 10
30-49 10 < 10 9 < 10
50-69 10 < 10 8 < 10
70- 8 < 10 7 < 10
妊婦付加量 + 1
授乳婦付加量 + 0

参照:
日本人の食事摂取基準(2015 年版)脂質 (pdf)
日本人の食事摂取基準(2010 年版)脂質 (pdf)

Saturated Fatty Acid

In many intervention trial in America and Europe, decreasing saturated fatty acid intakes have been recognized to decrease coronary heart disease morbidity, atherosclerosis and LDL cholesterol. In JPHC trial for Japanese, positive correlation has been observed between saturated fatty acid and the onset of myocardial infarction. However, it is not clear whether the decrease of saturated fatty acid intake causes the increase of cerebral hemorrhage.

Adult

It is considered that excessive intake of saturated fatty acids is the risk of atherosclerosis, especially myocardial infarction. In order to prevent of the onset and the aggravation, it’s important not only to limit the intake of saturated fatty acids but also to increase of intake of unsaturated fatty acids. In each country, saturated fatty acids intake in adult has been recommended less than 10 %E. American Heart Association and American Diabetes Association have been recommended less than 7 %E. In National Health and Nutrition Survey in 2011, saturated fatty acids intake of 20 years old or older Japanese was 6.9 %E. Therefore, the target amount of saturated fatty acids in adults has been set to less than 7 %E.

Child

Although it is considered that saturated fatty acid s intake should be less than 7 %E because the excessive intake of saturated fatty acids in child may cause coronary heart disease and obesity in middle age, research and related epidemiological studies and intervention trials were not enough to set the target amount of saturated fatty acids in child.

The Dietary Reference Intakes of saturated fatty acids 2015 edition and 2010 edition are following tables. They have not been set in infant, child, pregnant and lactation.

The Dietary Reference Intakes of saturated fatty acids (% energy) (2015 edition)
Gender Male Female
Age Target Amount Target Amount
0-5 M
6-11 M
1-2
3-5
6-7
8-9
10-11
12-14
15-17
18-29 ≤7 ≤7
30-49 ≤7 ≤7
50-69 ≤7 ≤7
70- ≤7 ≤7
Addition for Pregnant
Addition for lactation
The Dietary Reference Intakes of saturated fatty acids (% energy) (2010 edition)
Gender Male Female
Age Target Amount (range) Target Amount (range)
0-5 M
6-11 M
1-2
3-5
6-7
8-9
10-11
12-14
15-17
18-29 4.5≤<7 4.5≤<7
30-49 4.5≤<7 4.5≤<7
50-69 4.5≤<7 4.5≤<7
70- 4.5≤<7 4.5≤<7
Addition for Pregnant
Addition for Lactation

References:
The Dietary Reference Intakes for Japanese (2015 edition) Lipid (pdf)
The Dietary Reference Intake for Japanese (2010 edition) Lipid (pdf)

飽和脂肪酸

 欧米の多くの介入試験では飽和脂肪酸摂取量を減少させると冠動脈疾患罹患率,動脈硬化度,LDL コレステロール値の減少が認められています.日本人を対象とした JPHC 研究においては飽和脂肪酸摂取量と心筋梗塞発症に正相関が認められています.しかし,飽和脂肪酸摂取量減少が脳出血の増加を起こすかどうかについては分かっていません.

成人

 飽和脂肪酸の過剰摂取は動脈硬化性疾患,特に心筋梗塞のリスクと考えられています.その発症予防,重症化予防のために飽和脂肪酸の摂取量を制限するだけでなく多価不飽和脂肪酸の摂取量を増やすことが重要です.各国において成人における飽和脂肪酸摂取量は 10 %E 未満が望ましいとしています.アメリカ心臓協会およびアメリカ糖尿病学会は 7 %E 未満としています.平成 23 年国民健康・栄養調査によると 20 歳以上の日本人の飽和脂肪酸摂取量は 6.9 %E です.成人の飽和脂肪酸の目標量は 7 %E 未満に設定されました.

小児

 小児期の飽和脂肪酸の過剰摂取は中年での冠動脈疾患や肥満の原因となる可能性があり,小児期でも飽和脂肪酸の目標量は 7 %E 未満が望ましいとしながらも,疫学研究や関連する研究,介入試験が不十分であり小児の目標量の設定には至りませんでした.

 飽和脂肪酸の食事摂取基準の 2015 年版および 2010 年版は下表のとおりです.いずれも乳児・小児および妊婦・授乳婦については設定されていません.

飽和脂肪酸の食事摂取基準 (% energy) (2015 年版)
性別 男性 女性
年齢 目標量 目標量
0-5 M
6-11 M
1-2
3-5
6-7
8-9
10-11
12-14
15-17
18-29 ≤7 ≤7
30-49 ≤7 ≤7
50-69 ≤7 ≤7
70- ≤7 ≤7
妊婦(付加量)
授乳婦(付加量)
飽和脂肪酸の食事摂取基準 (% energy) (2010 年版)
性別 男性 女性
年齢 目標量(範囲) 目標量(範囲)
0-5 M
6-11 M
1-2
3-5
6-7
8-9
10-11
12-14
15-17
18-29 4.5≤<7 4.5≤<7
30-49 4.5≤<7 4.5≤<7
50-69 4.5≤<7 4.5≤<7
70- 4.5≤<7 4.5≤<7
妊婦(付加量)
授乳婦(付加量)

参照:
日本人の食事摂取基準(2015 年版)脂質 (pdf)
日本人の食事摂取基準(2010 年版)脂質 (pdf)

Lipid

The Dietary Reference Intakes have been set in lipids, saturated fatty acids, n-6 fatty acids and n-3 fatty acids. They have not been set in monounsaturated fatty acids, trans fatty acids, conjugated linoleic acid, diacylglycerol, medium chain triacylglycerol, plant sterols and cholesterol.

Especially, the Dietary Reference Intakes had been set for cholesterol in 2010 edition, such as 750 mg/d in male and 600 mg/d in female, they have been deleted in 2015 edition.

Lipid (fat energy ratio)

The Dietary Reference Intakes of lipid in 2015 edition and 2010 edition, the ratio of lipid in total energy (fat energy ratio), are following tables. The target amount in age group of grater than 30 years old has been revised. The Dietary Reference Intakes for pregnant and lactation have not been set.

The Dietary Reference Intakes of Lipid (% energy) (2015 edition)
Gender Male Female
Age Approximate amount Target amount (Median) Approximate amount Target amount (Median)
0-5 M 50 50
6-11 M 40 40
1-2 20-30 (25) 20-30 (25)
3-5 20-30 (25) 20-30 (25)
6-7 20-30 (25) 20-30 (25)
8-9 20-30 (25) 20-30 (25)
10-11 20-30 (25) 20-30 (25)
12-14 20-30 (25) 20-30 (25)
15-17 20-30 (25) 20-30 (25)
18-29 20-30 (25) 20-30 (25)
30-49 20-30 (25) 20-30 (25)
50-69 20-30 (25) 20-30 (25)
70- 20-30 (25) 20-30 (25)
Pregnant
Lactation
The Dietary Reference Intakes of Lipid (% energy) (2010 edition)
Gender Male Female
Age Approximate amount Target amount (Median) Approximate amount Target amount (Median)
0-5 M 50 50
6-11 M 40 40
1-2 20-30 20-30
3-5 20-30 20-30
6-7 20-30 20-30
8-9 20-30 20-30
10-11 20-30 20-30
12-14 20-30 20-30
15-17 20-30 20-30
18-29 20-30 20-30
30-49 20-25 20-25
50-69 20-25 20-25
70- 20-25 20-25
Pregnant
Lactation

References:
The Dietary reference Intakes for Japanese (2015 edition) Lipid (pdf)
THe Dietary reference Intakes for Japanese (2010 edition) Lipid (pdf)

脂質

 栄養学的に重要な脂質は脂肪酸,中性脂肪,リン脂質,糖脂質およびステロール類です.脂肪酸には二重結合を含まない飽和脂肪酸,二重結合が一つ存在する一価不飽和脂肪酸,二つ以上存在する多価不飽和脂肪酸があります.多価不飽和脂肪酸は二重結合の位置により n-3 系脂肪酸と n-6 系脂肪酸とに区別されます.不飽和脂肪酸には光学異性体があり,自然界にはシス型が大部分ですが,工業的に合成されるトランス型もあります.中性脂肪にはモノアシルグリセロール,ジアシルグリセロール,トリアシルグリセロールがあります.コレステロールはステロイド骨格を持ち炭化水素側鎖を持つ分子で,水にも油脂にも溶ける両親和性です.

 脂質は細胞膜の主要な成分でエネルギー産生の基質です.脂肪酸のエネルギー価は 9 kcal/g と炭水化物やたんぱく質の 2 倍以上です.また脂質は脂溶性ビタミン吸収を助けます.コレステロールは細胞膜の構成成分であり,肝臓で胆汁酸に変換されます.また性ホルモンや副腎皮質ホルモンなどのステロイドホルモン,ビタミン D の前駆体です.

 食事摂取基準が設定されたのは脂質,飽和脂肪酸,n-6 系脂肪酸,n-3 系脂肪酸のみです.一価不飽和脂肪酸やトランス脂肪酸,共役リノール酸,ジアシルグリセロールや中鎖トリアシルグリセロール,植物ステロール,コレステロールについては食事摂取基準は設定されていません.

 特にコレステロールについては 2010 年版では 18 歳以上の男性で 750 mg/d 未満,18 歳以上の女性で 600 mg/d 未満と食事摂取基準が設定されていましたが,2015 年版では撤廃されています.

脂質(脂肪エネルギー比率)

 2015 年版および 2010 年版における脂質の食事摂取基準,つまり脂質の総エネルギーに占める割合(脂質エネルギー比率)は下表のとおりです.2015 年版では 30 歳以上の目標量に変更がみられます.妊婦および授乳婦については摂取基準は設定されていません.

 0-5 ヶ月児の場合,母乳中の脂肪濃度は 3.5 g/100 g であり母乳 100 g 中の脂質由来のエネルギーは 31.5 kcal/100 g です.母乳 100g の総エネルギーは 65 kcal なので脂肪エネルギー比率は 48.46 % となり丸めて 50 %E と設定しました.6-11 ヶ月児の場合は 0-5 ヶ月児の目安量と 1-2 歳児の摂取量の中央値の平均値 37.9 %E に設定しました.1-2 歳児の摂取量は平成 22 年,23 年の国民健康・栄養調査に基づいています.

 小児および成人の脂質の目標量の下限値については,本文中に記載はありませんが,国民健康・栄養調査に基づいて 20 %E に設定されたようです.また欧米で低脂質とされるエネルギー比 30 %E 未満を目標量の上限値に設定したようです.

脂質の食事摂取基準 (% energy) (2015 年版)
性別 男性 女性
年齢 目安量 目標量(中央値) 目安量 目標量(中央値)
0-5 M 50 50
6-11 M 40 40
1-2 20-30 (25) 20-30 (25)
3-5 20-30 (25) 20-30 (25)
6-7 20-30 (25) 20-30 (25)
8-9 20-30 (25) 20-30 (25)
10-11 20-30 (25) 20-30 (25)
12-14 20-30 (25) 20-30 (25)
15-17 20-30 (25) 20-30 (25)
18-29 20-30 (25) 20-30 (25)
30-49 20-30 (25) 20-30 (25)
50-69 20-30 (25) 20-30 (25)
70- 20-30 (25) 20-30 (25)
妊婦
授乳婦
脂質の食事摂取基準 (% energy) (2010 年版)
性別 男性 女性
年齢 目安量 目標量(範囲) 目安量 目標量(範囲)
0-5 M 50 50
6-11 M 40 40
1-2 20-30 20-30
3-5 20-30 20-30
6-7 20-30 20-30
8-9 20-30 20-30
10-11 20-30 20-30
12-14 20-30 20-30
15-17 20-30 20-30
18-29 20-30 20-30
30-49 20-25 20-25
50-69 20-25 20-25
70- 20-25 20-25
妊婦
授乳婦

参照:
日本人の食事摂取基準(2015 年版)脂質 (pdf)
日本人の食事摂取基準(2010 年版)脂質 (pdf)

Protein

RecommendeAmountProtein

The reports of protein have 9 pages and 73 references in 2010 edition and 14 pages and 119 references in 2015 edition, respectively.

Although upper limit of protein intake is not set in 2010 edition, it’s preferred that protein intake is less than 2.0 g/kg/d in adult.

It is focused on severity of disease in 2015 edition. If protein-energy ratio was greater than 20 % energy, the risk of diabetes, cardiovascular disease, the incidence of cancer, bone loss and the increase of BMI would develop. Then it should be noted that protein-energy ratio should not be more than 20 % energy.

Estimated Average Requirement of indispensable amino acids (essential amino acids) has been described for only adult in 2010 edition and they have been described not only for adult but also for child and infant in 2015 edition, respectively.

Dietary reference intakes of the proteins of the 2015 edition is as follow table.

Dietary Reference Intakes of the proteins (g/d), Target (median) % energy) 2015 edition
Gender Male Female
Age Estimated Average Requirement Recommended amount Approximate amount Target amount (Median) Estimated Average Requirement Recommended amount Approximate amount Target amount (Median)
0-5 M 10 10
6-8 M 15 15
9-11 M 25 25
1-2 15 20 13-20 (16.5) 15 20 13-20 (16.5)
3-5 20 25 13-20 (16.5) 20 25 13-20 (16.5)
6-7 25 35 13-20 (16.5) 25 30 13-20 (16.5)
8-9 35 40 13-20 (16.5) 30 40 13-20 (16.5)
10-11 40 50 13-20 (16.5) 40 50 13-20 (16.5)
12-14 50 60 13-20 (16.5) 45 55 13-20 (16.5)
15-17 50 65 13-20 (16.5) 45 55 13-20 (16.5)
18-29 50 60 13-20 (16.5) 40 50 13-20 (16.5)
30-49 50 60 13-20 (16.5) 40 50 13-20 (16.5)
50-69 50 60 13-20 (16.5) 40 50 13-20 (16.5)
70- 50 60 13-20 (16.5) 40 50 13-20 (16.5)
Additional protein in early pregnant 0 0
Additional protein in mid pregnant 5 10
Additional protein in late pregnant 20 25
Additional protein in lactation 15 20

Dietary reference intakes of the proteins of the 2010 edition is as follow table.

Dietary Reference Intakes of the proteins (g/d) 2010 edition
Gender Male Female
Age Estimated Average Requirement Recommended amount Approximate amount Upper limit amount Estimated Average Requirement Recommended amount Approximate amount Upper limit amount
0-5 M 10 10
6-8 M 15 15
9-11 M 25 25
1-2 15 20 15 20
3-5 20 25 20 25
6-7 25 30 25 30
8-9 30 40 30 40
10-11 40 45 35 45
12-14 45 60 45 55
15-17 50 60 45 55
18-29 50 60 40 50
30-49 50 60 40 50
50-69 50 60 40 50
70- 50 60 40 50
Additional protein in early pregnant 0 0
Additional protein in mid pregnant 5 10
Additional protein in late pregnant 20 25
Additional protein in lactation 15 20

The recommended amount is based on the proteins maintain the required amount from nitrogen balance experiment, corrected in the digestibility of daily meal mixed protein, used to calculate the reference value of the Estimated Average Requirement calculation and is calculated the recommended amount by the addition of interindividual variability.

Recommended amount of protein (g/d) is product of Estimated Average Requirement and Recommended amount calculated coefficient. The Estimated Average Requirement is product of Reference value of the Estimated Average Requirement Calculation (g/kg/d) and reference weight (kg). Reference value of the Estimated Average Requirement calculation is obtained by dividing protein maintain the required amount (g/kg/d) by the digestibility.

Recommended amount calculated coefficient is 1.25. The digestibility is 0.9.

Adult

The proteins maintain the required amount of adult, that has been determined from the average of 17 studies examined the nitrogen balance maintenance dose of animal protein, is 0.65 g/kg/d, divided it by the digestibility 0.9, Reference value of the Estimated Average Requirement Calculation is obtained as 0.72 g/kg/d.

\mathrm{Estimated\ Averege\ Requirement}=0.72\times\mathrm{Reference\ Weight}
\mathrm{Recommended\ Amount}=\mathrm{Estimated\ Average\ Requirement}\times1.25

Elderly

Estimated Average Requirement of protein of elderly, that have been calculated from the pooled analysis using 144 data nitrogen balance of 60 subjects of five studies, is 0.85 g/kg/d (corrected by the digestibility).

Child

The reference value for calculation of Estimated Average Requirement in child the sum of the required amount of protein maintenance and the amount of protein accumulation. The Estimated Average Requirement is the product of the reference value for calculation of Estimated Average Requirement and reference weight. The recommended amount is the product of the Estimated Average Requirement and recommended amount calculation coefficient 1.25. The required amount of protein maintain is 0.67 g/kg/d.

Estimated Average Requirement and recommended amount of protein about child is following table. Predictive equation following is correct in 2015 edition, although predictive equation of 2010 edition is wrong.

Estimated Average Requirement and recommended amount of protein about child 2015 edition
Male child
A B C D E F G H I
Age (Y) Reference weight (kg) Weight gain (kg/Y) Body protein (%) Body protein accumulation (g/kg/d) Accumulation efficiency (%) Proteins maintain the required amount (g/kg/d) Utilization efficiency (%) Estimated Average Requirement (g/d) Recommended amount (g/d)
1-2 11.5 2.1 13.2 0.064 40 0.67 70 12.9 16.1
3-5 16.5 2.1 14.7 0.050 40 0.67 70 17.9 22.3
6-7 22.2 2.7 15.5 0.051 40 0.67 70 24.1 30.1
8-9 28.0 3.2 14.5 0.046 40 0.67 70 30.0 37.5
10-11 35.6 4.7 13.9 0.050 40 0.67 75 36.3 45.3
12-14 49.0 5.1 13.9 0.039 40 0.67 80 45.9 57.3
15-17 59.7 2.0 15.0 0.014 40 0.67 85 49.1 61.4
Female child
A B C D E F G H I
Age (Y) Reference weight (kg) Weight gain (kg/Y) Body protein (%) Body protein accumulation (g/kg/d) Accumulation efficiency (%) Proteins maintain the required amount (g/kg/d) Utilization efficiency (%) Estimated Average Requirement (g/d) Recommended amount (g/d)
1-2 11.0 2.2 13.0 0.070 40 0.67 70 12.5 15.6
3-5 16.1 2.1 14.1 0.051 40 0.67 70 17.5 21.8
6-7 21.9 2.5 14.1 0.045 40 0.67 70 23.4 29.3
8-9 27.4 3.4 13.7 0.046 40 0.67 70 29.4 36.7
10-11 36.3 5.1 14.6 0.057 40 0.67 75 37.6 47.0
12-14 47.5 3.0 14.8 0.026 40 0.67 80 42.8 53.6
15-17 51.9 0.7 11.9 0.004 40 0.67 85 41.5 51.8
\displaystyle D = \frac{B\times1,000}{365} \times \frac{C}{100 \times A}\\  \\  H = \left( \frac{D}{E} \times 100 + \frac{F}{G} \times 100 \right) \times A\\  \\  I = H \times 1.25

Infant

The target amount of protein in infant in human milk is 9.83 g/d in 0-5 months, 12.5 g/d in 6-8 months and 22.0 g/d in 9-11 months, respectively. The target amount in artificial feeding is 14.0 g/d in 0-5 months, 15.2 g/d in 6-8 months and 23.8 g/d in 9-11 months, respectively.

Pregnant

It’s assumed that the weight gain in full-term is 11.0 kg in pregnant. The additional protein is obtained indirectly by calculating the body potassium increased amount. Estimated Average Requirement is 0 g/d in early pregnant, 4.51 g/d in mid pregnant and 18.98 g/d in late pregnant, respectively. The recommended amount of additional protein is 0 g/d in early pregnant, 5.64 g/d in mid pregnant and 23.73 g/d in late pregnant, respectively.

Lactation

Estimated Average Requirement of lactation is 14.04 g/d and recommended amount is 17.6 g/d, respectively. The average milk yield per day is 0.78 L/d and the average of the protein concentration in human milk is 12.6 g/L, respectively. Conversion efficiency of human milk protein from dietary protein is 70 %.

Reference:
Protein (The Dietary Reference Intakes for Japanese 2015 edition) (pdf)
Protein (The Dietary Reference Intakes for Japanese 2010 edition) (pdf)

たんぱく質

RecommendeAmountProtein

 たんぱく質についての記載は 2010 年版では 9 ページ,参考文献は 73 件ですが 2015 年版では 14 ページ,参考文献 119 件に増えています.

 2010 年版では耐用上限量を設定していませんが,成人においてはたんぱく質摂取量は 2.0 g/kg/d 未満に留めるのが望ましいとしています.

 2015 年版では生活習慣病の重症化予防に重点を置いており,たんぱく質エネルギー比率が 20 % エネルギーを超えた場合の健康障害として糖尿病発症リスクの増加,心血管疾患の増加,がんの発症率の増加,骨量の減少,BMI の増加を挙げて,たんぱく質エネルギー比率が 20 % エネルギーを超えないように注意を喚起しています.

 不可欠アミノ酸(必須アミノ酸)の推定平均必要量については 2010 年版では成人のみ記載されていましたが 2015 年版では乳児・小児についても記載が追加されています.

 2015 年版のたんぱく質の食事摂取基準は下表のとおりです.

たんぱく質の食事摂取基準(推定平均必要量・推奨量・目安量 (g/d), 目標量(中央値) % エネルギー)2015 年版
性別 男性 女性
年齢 推定平均必要量 推奨量 目安量 目標量 (中央値) 推定平均必要量 推奨量 目安量 目標量 (中央値)
0-5 M 10 10
6-8 M 15 15
9-11 M 25 25
1-2 15 20 13-20 (16.5) 15 20 13-20 (16.5)
3-5 20 25 13-20 (16.5) 20 25 13-20 (16.5)
6-7 25 35 13-20 (16.5) 25 30 13-20 (16.5)
8-9 35 40 13-20 (16.5) 30 40 13-20 (16.5)
10-11 40 50 13-20 (16.5) 40 50 13-20 (16.5)
12-14 50 60 13-20 (16.5) 45 55 13-20 (16.5)
15-17 50 65 13-20 (16.5) 45 55 13-20 (16.5)
18-29 50 60 13-20 (16.5) 40 50 13-20 (16.5)
30-49 50 60 13-20 (16.5) 40 50 13-20 (16.5)
50-69 50 60 13-20 (16.5) 40 50 13-20 (16.5)
70- 50 60 13-20 (16.5) 40 50 13-20 (16.5)
妊婦初期付加量 0 0
妊婦中期付加量 5 10
妊婦後期付加量 20 25
授乳婦 付加量 15 20

 2010 年版のたんぱく質の食事摂取基準は下表のとおりです.

たんぱく質の食事摂取基準 (g/d) 2010 年版
性別 男性 女性
年齢 推定平均必要量 推奨量 目安量 耐用上限量 推定平均必要量 推奨量 目安量 耐用上限量
0-5 M 10 10
6-8 M 15 15
9-11 M 25 25
1-2 15 20 15 20
3-5 20 25 20 25
6-7 25 30 25 30
8-9 30 40 30 40
10-11 40 45 35 45
12-14 45 60 45 55
15-17 50 60 45 55
18-29 50 60 40 50
30-49 50 60 40 50
50-69 50 60 40 50
70- 50 60 40 50
妊婦初期付加量 0 0
妊婦中期付加量 5 10
妊婦後期付加量 20 25
授乳婦 付加量 15 20

 窒素出納実験により測定された動物性たんぱく質のたんぱく質維持必要量をもとに,それを日常食混合たんぱく質の消化率で補正して推定平均必要量算定の参照値を算定し,その上に個人間変動を加えて推奨量を算定します.

 たんぱく質の推奨量 (g/d) は,推定平均必要量 (g/d) と推奨量算定係数との積です.推定平均必要量は,推定平均必要量算定の参照値 (g/kg/d) と参照体重 (kg) との積です.推定平均必要量算定の参照値は,たんぱく質維持必要量 (g/kg/d) を消化率で除した値です.

 推奨量算定系数は 1.25 です.消化率は 0.9 です.

成人

 動物性たんぱく質の窒素出納維持量を検討した 17 の研究の平均値から求めた成人のたんぱく質維持必要量は 0.65 g/kg/d で,消化率 0.9 で割ると推定平均必要量算定の参照値は 0.72 g/kg/d です.

\mathrm{Estimated\ Averege\ Requirement}=0.72\times\mathrm{Reference\ Weight}
\mathrm{Recommended\ Amount}=\mathrm{Estimated\ Average\ Requirement}\times1.25

高齢者

 高齢者のたんぱく質推定平均必要量は 0.85 g/kg/d です(ただし消化率で補正済み).5 つの研究の 60 名の被験者の窒素出納 144 データを用いたプール解析から算出した値です.

小児

 小児の推定平均必要量算定の参照値は,たんぱく質維持必要量とたんぱく質蓄積量の和です.推定平均必要量は,推定平均必要量算定の参照値に参照体重を乗じて求めます.推奨値は推定平均必要量に推奨量算定係数 1.25 を乗じた値です.たんぱく質維持必要量は 0.67 g/kg/d です.

小児についてはさらに下表のように詳細な記載があります.2010 年版もありますが,基準体重の数値およびその計算結果が異なるだけなので掲載しません.また小児の推定平均必要量算定の参照値を求める下式は 2010 年版は誤りで,2015 年版が正しい式です.

小児の推定平均必要量,推奨量 2015 年版
男子
A B C D E F G H I
年齢 (Y) 参照体重 (kg) 体重増加量 (kg/Y) 体たんぱく質 (%) 体たんぱく質蓄積量 (g/kg/d) 蓄積効率 (%) たんぱく質維持必要量 (g/kg/d) 利用効率 (%) 推定平均必要量 (g/d) 推奨量 (g/d)
1-2 11.5 2.1 13.2 0.064 40 0.67 70 12.9 16.1
3-5 16.5 2.1 14.7 0.050 40 0.67 70 17.9 22.3
6-7 22.2 2.7 15.5 0.051 40 0.67 70 24.1 30.1
8-9 28.0 3.2 14.5 0.046 40 0.67 70 30.0 37.5
10-11 35.6 4.7 13.9 0.050 40 0.67 75 36.3 45.3
12-14 49.0 5.1 13.9 0.039 40 0.67 80 45.9 57.3
15-17 59.7 2.0 15.0 0.014 40 0.67 85 49.1 61.4
女子
A B C D E F G H I
年齢 (Y) 参照体重 (kg) 体重増加量 (kg/Y) 体たんぱく質 (%) 体たんぱく質蓄積量 (g/kg/d) 蓄積効率 (%) たんぱく質維持必要量 (g/kg/d) 利用効率 (%) 推定平均必要量 (g/d) 推奨量 (g/d)
1-2 11.0 2.2 13.0 0.070 40 0.67 70 12.5 15.6
3-5 16.1 2.1 14.1 0.051 40 0.67 70 17.5 21.8
6-7 21.9 2.5 14.1 0.045 40 0.67 70 23.4 29.3
8-9 27.4 3.4 13.7 0.046 40 0.67 70 29.4 36.7
10-11 36.3 5.1 14.6 0.057 40 0.67 75 37.6 47.0
12-14 47.5 3.0 14.8 0.026 40 0.67 80 42.8 53.6
15-17 51.9 0.7 11.9 0.004 40 0.67 85 41.5 51.8
\displaystyle D = \frac{B\times1,000}{365} \times \frac{C}{100 \times A}\\  \\  H = \left( \frac{D}{E} \times 100 + \frac{F}{G} \times 100 \right) \times A\\  \\  I = H \times 1.25

乳児

 乳児については目安量となります.0-5 ヶ月では 9.83 g/d であり, 6-8 ヶ月では 12.5 g/d であり, 9-11 ヶ月では 22.0 g/d です.人工栄養児の目安量は 0-5 ヶ月では 14.0 g/d であり, 6-8 ヶ月では 15.2 g/d であり, 9-11 ヶ月では 23.8 g/d です.

妊婦

 妊婦ではたんぱく質の付加量を最終的な体重増加を 11.0 kg と仮定し,体カリウム増加量から間接的に算定します.妊婦の付加量の推定平均必要量は初期は 0 g/d であり,中期は 4.51 g/d であり,後期は 18.98 g/d です.妊婦の付加量の推奨量は初期は 0 g/d であり,中期は 5.64 g/d であり,後期は 23.73 g/d です.

授乳婦

 授乳婦の付加量の推定平均必要量は 14.04 g/d, 推奨量は 17.6 g/d です.1 日の平均泌乳量は 0.78 L/d であり,母乳中のたんぱく質濃度の平均値は 12.6 g/L です.食事性たんぱく質の母乳たんぱく質への変換効率は 70 % です.

不可欠アミノ酸

 不可欠アミノ酸(必須アミノ酸)の推定平均必要量は下記のとおりです.

不可欠アミノ酸の推定平均必要量 2015 年版
His Ile Leu Lys SAA AAA Thr Trp Val Total
組織アミノ酸パターン 27 35 75 73 35 73 42 12 49 421
維持アミノ酸パターン 15 30 59 45 22 38 23 6 39 277
たんぱく質必要量 (g/kg/d) に対するアミノ酸必要量 (mg/kg/d)
年齢 維持量 成長量 His Ile Leu Lys SAA AAA Thr Trp Val Total
0.5 0.66 0.46 22 36 73 63 31 59 35 9.5 48 376
1-2 0.66 0.20 15 27 54 44 22 40 24 6.4 36 267
3-10 0.66 0.07 12 22 44 35 17 30 18 4.8 29 212
11-14 0.66 0.07 12 22 44 35 17 30 18 4.8 29 212
15-17 0.66 0.04 11 21 42 33 16 28 17 4.5 28 200
18- 0.66 0.00 10 20 39 30 15 25 15 4.0 26 183
評点パターン (mg/g protein)
年齢 His Ile Leu Lys SAA AAA Thr Trp Val Total
0.5 20 32 66 57 28 52 31 8.5 43 336
1-2 18 31 63 52 25 46 27 7.4 41 310
3-10 16 30 61 48 23 41 25 6.6 40 291
11-14 16 30 61 48 23 41 25 6.6 40 291
15-17 16 30 60 47 23 40 24 6.4 40 286
18- 15 30 59 45 22 38 23 6.0 39 277

参照:
日本人の食事摂取基準(2015 年版)たんぱく質 (pdf)
日本人の食事摂取基準(2010 年版)たんぱく質 (pdf)

Estimated Energy Requirement

EER in male
EER in male

EER in female
EER in female

Estimated Energy Requirement

Estimated energy requirement (EER) in 2015 edition is as following table.

Estimated Energy Requirement (kcal/d)
Gender Male Female
Physical Activity Level I II III I II III
0-5 (M) 550 500
6-8 (M) 650 600
9-11 (M) 700 650
1-2 950 900
3-5 1,300 1,250
6-7 1,350 1,550 1,750 1,250 1,450 1,650
8-9 1,600 1,850 2,100 1,500 1,700 1,900
10-11 1,950 2,250 2,500 1,850 2,100 2,350
12-14 2,300 2,600 2,900 2,150 2,400 2,700
15-17 2,500 2,850 3,150 2,050 2,300 2,550
18-29 2,300 2,650 3,050 1,650 1,950 2,200
30-49 2,300 2,650 3,050 1,750 2,000 2,300
50-69 2,100 2,450 2,800 1,650 1,900 2,200
70- 1,850 2,200 2,500 1,500 1,750 2,000
Additional Energy in Early Gestation + 50 + 50 + 50
Additional Energy in Midgestation + 250 + 250 + 250
Additional Energy in Late Gestation + 450 + 450 + 450
Additional Energy in Lactation + 350 + 350 + 350

Basal Metabolic Rate

Basal metabolic rate (BMR) for Japanese is based on basal metabolism reference value (BMRV). BMR is obtained by BMRV multiplied by reference weight (RW).

BMR in 2015 edition is as following table. A little difference is found in reference weight between 2010 edition and 2015 edition.

Basal Metabolic Rate in Reference weight
Gender Male Female
Age (years) BMRV (kcal/kg/d) RW (kg) BMR (kcal/d) BMRV (kcal/kg/d) RW (kg) BMR (kcal/d)
1-2 61.0 11.5 700 59.7 11.0 660
3-5 54.8 16.5 900 52.2 16.1 840
6-7 44.3 22.2 980 41.9 21.9 920
8-9 40.8 28.0 1140 38.3 27.4 1050
10-11 37.4 35.6 1330 34.8 36.3 1260
12-14 31.0 49.0 1520 29.6 47.5 1410
15-17 27.0 59.7 1610 25.3 51.9 1310
18-29 24.0 63.2 1520 22.1 50.0 1110
30-49 22.3 68.5 1530 21.7 53.1 1150
50-69 21.5 65.3 1400 20.7 53.0 1100
70- 21.5 60.0 1290 20.7 49.5 1020

Basal metabolic rate in 2010 edition is as following table.

Basal Metabolic Rate in Standard Weight
Gender Male Female
Age (years) BMRV (kcal/kg/d) RW (kg) BMR (kcal/d) BMRV (kcal/kg/d) RW (kg) BMR (kcal/d)
1-2 61.0 11.7 710 59.7 11.0 660
3-5 54.8 16.8 890 52.2 16.2 850
6-7 44.3 22.0 980 41.9 22.0 920
8-9 40.8 27.5 1120 38.3 27.2 1040
10-11 37.4 35.5 1330 34.8 34.5 1200
12-14 31.0 48.0 1490 29.6 46.0 1360
15-17 27.0 58.4 1580 25.3 50.6 1280
18-29 24.0 63.0 1510 22.1 50.6 1120
30-49 22.3 68.5 1530 21.7 53.0 1150
50-69 21.5 65.0 1400 20.7 53.6 1110
70- 21.5 59.7 1280 20.7 49.0 1010

Then I’d like to describe about basis of computation depend on such age groups as adult, child, infant, pregnant and lactation.

Adult

EER in adult is obtained by multiplying BMR, it’s obtained by BMRV multiplied by RW, by physical activity level (PAL). I’d like to describe about PAL at last.

\displaystyle \mathrm{EER\ (kcal/d)} = \mathrm{BMRV\ (kcal/kg/d)} \times \mathrm{RW\ (kg)} \times \mathrm{PAL} \\  \\  \mathrm{EER: estimated\ energy\ requirement}\\  \mathrm{BMRV: basal\ metabolism\ reference\ value} \\  \mathrm{RW: reference\ weight}\\  \mathrm{PAL: physical\ activity\ level}

If BMI is less than 30, basal metabolic rate for Japanese is obtained by following equation, the function of age, gender, height and weight.

\displaystyle \mathrm{BMR\ (kcal/d)}\\   = 0.0481 \times \mathrm{W\ (kg)} + 0.0234 \times \mathrm{H\ (cm)} - 0.0138 \times \mathrm{A\ (years)} - \mathrm{C} \\  \\  \mathrm{BMR:\ basal\ metabolic\ rate}\\  \mathrm{W : weight}\\  \mathrm{H : height}\\  \mathrm{A : age}\\  \mathrm{C : 0.4235\ (male), 0.9708\ (female)}

Child

EER in child is obtained by BMR multiplied by PAL and adding energy storage (ES). PAL in child is obtained by systematic review based on 24 studies in 2010 edition and 35 studies in 2015 edition, respectively.

\displaystyle \mathrm{EER\ (kcal/d)} = \mathrm{BMR\ (kcal/d)} \times \mathrm{PAL} + \mathrm{ES\ (kcal/d)}\\  \\  \mathrm{BMR: basal\ metabolic\ rate}\\  \mathrm{ES: energy\ storage}\\

Infant

EER in infant is obtained by adding total energy expenditure (TEE) to ES. TEE in infant is obtained by regression equation that has only weight as one independent variable according to FAO/WHO/UNU.

\displaystyle \mathrm{EER\ (kcal/d)} = \mathrm{TEE\ (kcal/d)} + \mathrm{ES\ (kcal/d)}\\  \\  \mathrm{TEE: total\ energy\ expenditure}

TEE in breastfed infant is obtained by following equation.

\mathrm{TEE\ (kcal/d)} = 92.8 \times \mathrm{RW\ (kg) }- 152.0

TEE in formula-fed infant is obtained by following equation.

\mathrm{TEE\ (kcal/d)} = 82.6 \times \mathrm{RW\ (kg)} - 29.0

Energy storage is the additional energy for increasing tissue in growing infant and child. Energy storage is as following table.

Energy Storage
Gender Male Female
Age (years) RW (kg) Weight Gain (kg/y) Tissue Increase RW (kg) Weight Gain (kg/y) Tissue Increase
Energy Density (kcal/g) Energy Storage (kcal/d) Energy Density (kcal/g) Energy Storage (kcal/d)
0-5 M 6.4 9.5 4.4 120 5.9 8.7 5.0 120
6-8 M 8.5 3.4 1.5 15 7.8 3.4 1.8 15
9-11 M 9.1 2.4 2.7 15 8.5 2.5 2.3 15
1-2 11.7 2.1 3.5 20 11.0 2.1 2.4 15
3-5 16.2 2.1 1.5 10 16.2 2.2 2.0 10
6-7 22.0 2.5 2.1 15 22.0 2.5 2.8 20
8-9 27.5 3.4 2.5 25 27.2 3.1 3.2 25
10-11 35.5 4.5 3.0 35 34.5 4.1 2.6 30
12-14 48.0 4.2 1.5 20 46.0 3.1 3.0 25
15-17 58.4 2.0 1.9 10 50.6 0.8 4.7 10

Pregnant

EER in pregnant is obtained by following equation. It’s assumed that weight gain at 9 months is 11 kg. Additional energy in pregnant is 50 kcal/d in early gestation, 250 kcal/d in mid gestation and 450 kcal/d in late gestation, respectively.

\displaystyle \mathrm{EER\ of\ pregnant\ (kcal/d)} \\  = \mathrm{EER\ before\ pregnancy\ (kcal/d)} + \mathrm{AE\ (kcal/d)}\\  \\  \mathrm{AE\ :\ additional\ energy}

Lactation

EER in lactation is obtained by following equation. Additional energy in lactation is 350 kcal/d. Energy content of human milk is 663 kcal/L.

\displaystyle \mathrm{EER\ of\ nursing\ women\ (kcal/d)} \\  = \mathrm{EER\ before\ pregnancy\ (kcal/d)} + \mathrm{AE\ (kcal/d)}

Physical Activity Level

Physical activity level (PAL) is an index of physical activity obtained by daily energy consumption divided by BMR. PAL is directly observed by doubly-labeled water method. A hydrogen atom is usually a proton with one atomic weight and an oxgen atom is 16 atomic weight, respectively. Stable isotope of them are deuterium with 2 atomic weight and heavy oxygen with 17 or 18 atomic weight, respectively. Doubly labeled water method is that titrate the ratio of excretion to urine of the heavy oxygen and deuterium. It’s the most accurate method.

Physical activity level in 2015 edition is as following table. The population was divided into 3 groups according to 25 percentile and 75 percentile, sorted in ascending order, I, II and III. The representative value of each groups are 1.50, 1.75 2.00, respectively.

Physical Activity Level according to age group in 2015 edition (Unisex)
Physical Activity Level I (Low) II (Middle) III (High)
1-2 1.35
3-5 1.45
6-7 1.35 1.55 1.75
8-9 1.40 1.60 1.80
10-11 1.45 1.65 1.85
12-14 1.50 1.70 1.90
15-17 1.55 1.75 1.95
18-29 1.50 1.75 2.00
30-49 1.50 1.75 2.00
50-69 1.50 1.75 2.00
70- 1.45 1.70 1.95

Physical activity level in 2010 edition is as following table.

Physical Activity Level according to age group in 2010 edition (Unisex)
Physical Activity Level I (Low) II (Middle) III (High)
1-2 1.35
3-5 1.45
6-7 1.35 1.55 1.75
8-9 1.40 1.60 1.80
10-11 1.45 1.65 1.85
12-14 1.45 1.65 1.85
15-17 1.55 1.75 1.95
18-29 1.50 1.75 2.00
30-49 1.50 1.75 2.00
50-69 1.50 1.75 2.00
70- 1.45 1.70 1.95

Reference:
The Dietary Reference Intakes for Japanese 2015 edition Energy (pdf)
The Dietary Reference Intakes for Japanese 2010 edition Energy (pdf)

推定エネルギー必要量

推定エネルギー必要量(男性)
推定エネルギー必要量(男性)

推定エネルギー必要量(女性)
推定エネルギー必要量(女性)

推定エネルギー必要量

 最初にまとめの表を出しておきます.2015 年版の推定エネルギー必要量は下記のとおりです.2010 年版には特に下記のような表はありません.

推定エネルギー必要量 (kcal/d)
性別 男性 女性
身体活動レベル I II III I II III
0-5 (M) 550 500
6-8 (M) 650 600
9-11 (M) 700 650
1-2 950 900
3-5 1,300 1,250
6-7 1,350 1,550 1,750 1,250 1,450 1,650
8-9 1,600 1,850 2,100 1,500 1,700 1,900
10-11 1,950 2,250 2,500 1,850 2,100 2,350
12-14 2,300 2,600 2,900 2,150 2,400 2,700
15-17 2,500 2,850 3,150 2,050 2,300 2,550
18-29 2,300 2,650 3,050 1,650 1,950 2,200
30-49 2,300 2,650 3,050 1,750 2,000 2,300
50-69 2,100 2,450 2,800 1,650 1,900 2,200
70- 1,850 2,200 2,500 1,500 1,750 2,000
妊婦初期付加量 + 50 + 50 + 50
妊婦中期付加量 + 250 + 250 + 250
妊婦後期付加量 + 450 + 450 + 450
授乳婦付加量 + 350 + 350 + 350

基礎代謝量

 日本人において基礎代謝量の計算のもとになっているのは基礎代謝基準値です.該当する年齢階級および性別の基礎代謝基準値に参照体重をかけて基礎代謝量とするのが計算の基本です.

 2015 年版の基礎代謝量は下記のとおりです.2010 年版との違いは体重およびその計算結果の基礎代謝量であり,基礎代謝基準値そのものは変わっていません.

参照体重における基礎代謝量
性別 男性 女性
年齢 (years) 基礎代謝基準値 (kcal/kg/d) 参照体重 (kg) 基礎代謝量 (kcal/d) 基礎代謝基準値 (kcal/kg/d) 参照体重 (kg) 基礎代謝量 (kcal/d)
1-2 61.0 11.5 700 59.7 11.0 660
3-5 54.8 16.5 900 52.2 16.1 840
6-7 44.3 22.2 980 41.9 21.9 920
8-9 40.8 28.0 1140 38.3 27.4 1050
10-11 37.4 35.6 1330 34.8 36.3 1260
12-14 31.0 49.0 1520 29.6 47.5 1410
15-17 27.0 59.7 1610 25.3 51.9 1310
18-29 24.0 63.2 1520 22.1 50.0 1110
30-49 22.3 68.5 1530 21.7 53.1 1150
50-69 21.5 65.3 1400 20.7 53.0 1100
70- 21.5 60.0 1290 20.7 49.5 1020

 2010 年版における基準体重における基礎代謝量は下記のとおりです.

基礎代謝量
性別 男性 女性
年齢 (years) 基礎代謝基準値 (kcal/kg/d) 基準体重 (kg) 基礎代謝量 (kcal/d) 基礎代謝基準値 (kcal/kg/d) 基準体重 (kg) 基礎代謝量 (kcal/d)
1-2 61.0 11.7 710 59.7 11.0 660
3-5 54.8 16.8 890 52.2 16.2 850
6-7 44.3 22.0 980 41.9 22.0 920
8-9 40.8 27.5 1120 38.3 27.2 1040
10-11 37.4 35.5 1330 34.8 34.5 1200
12-14 31.0 48.0 1490 29.6 46.0 1360
15-17 27.0 58.4 1580 25.3 50.6 1280
18-29 24.0 63.0 1510 22.1 50.6 1120
30-49 22.3 68.5 1530 21.7 53.0 1150
50-69 21.5 65.0 1400 20.7 53.6 1110
70- 21.5 59.7 1280 20.7 49.0 1010

 さて,それでは各年齢階級の計算の根拠を示していきます.成人,小児,乳児,妊婦,授乳婦に分けて説明します.

成人

 成人の推定エネルギー必要量は基礎代謝基準値に参照体重をかけて基礎代謝量を求め,さらに身体活動レベルをかけて求めます.身体活動レベルについては最後に述べます.

\displaystyle \mathrm{EER\ (kcal/d)} = \mathrm{BMRV\ (kcal/kg/d)} \times \mathrm{RW\ (kg)} \times \mathrm{PAL} \\  \\  \mathrm{EER: estimated\ energy\ requirement}\\  \mathrm{BMRV: basal\ metabolism\ reference\ value} \\  \mathrm{RW: reference\ weight}\\  \mathrm{PAL: physical\ activity\ level}

 BMI が 30 までなら年齢,性別,身長,体重を用いた日本人の基礎代謝量は下記の推定式で得られます.

\displaystyle \mathrm{BMR\ (kcal/d)}\\   = 0.0481 \times \mathrm{W\ (kg)} + 0.0234 \times \mathrm{H\ (cm)} - 0.0138 \times \mathrm{A\ (years)} - \mathrm{C} \\  \\  \mathrm{BMR:\ basal\ metabolic\ rate}\\  \mathrm{W : weight}\\  \mathrm{H : height}\\  \mathrm{A : age}\\  \mathrm{C : 0.4235\ (male), 0.9708\ (female)}

小児

 小児の推定エネルギー必要量は基礎代謝量に身体活動レベルをかけ,エネルギー蓄積量 (ES) を足して求めます.小児の身体活動レベルは 2010 年版では24 件,2015 年版では 35 件の報告を元に系統的レビューを行い算出しています.計算式は以下のとおりです.

\displaystyle \mathrm{EER\ (kcal/d)} = \mathrm{BMR\ (kcal/d)} \times \mathrm{PAL} + \mathrm{ES\ (kcal/d)}\\  \\  \mathrm{BMR: basal\ metabolic\ rate}\\  \mathrm{ES: energy\ storage}\\

乳児

 乳児の推定エネルギー必要量は総エネルギー消費量 (TEE) にエネルギー蓄積量 (ES) を足して求めます.乳児の総エネルギー消費量は FAO/WHO/UNU によると体重だけを独立変数とする式で説明可能としています.計算式は以下のとおりです.

\displaystyle \mathrm{EER\ (kcal/d)} = \mathrm{TEE\ (kcal/d)} + \mathrm{ES\ (kcal/d)}\\  \\  \mathrm{TEE: total\ energy\ expenditure}

 母乳栄養児の総エネルギー消費量は以下です.

\mathrm{TEE\ (kcal/d)} = 92.8 \times \mathrm{RW\ (kg) }- 152.0

 人工栄養児の総エネルギー消費量は以下です.

\mathrm{TEE\ (kcal/d)} = 82.6 \times \mathrm{RW\ (kg)} - 29.0

 エネルギー蓄積量とは乳児・小児における成長に伴う組織増加分のエネルギーのことです.基準体重から 1 日あたりの体重増加量を計算し,組織増加分のエネルギー密度との積で計算します.エネルギー蓄積量は下記のとおりです.2010 年版では参照体重を基準体重と表記しているだけで 2015 年版と数値に違いはありません.

エネルギー蓄積量
性別 男性 女性
年齢 (years) 参照体重 (kg) 体重増加量 (kg/y) 組織増加分 参照体重 (kg) 体重増加量 (kg/y) 組織増加分
エネルギー密度 (kcal/g) エネルギー蓄積量 (kcal/d) エネルギー密度 (kcal/g) エネルギー蓄積量 (kcal/d)
0-5 M 6.4 9.5 4.4 120 5.9 8.7 5.0 120
6-8 M 8.5 3.4 1.5 15 7.8 3.4 1.8 15
9-11 M 9.1 2.4 2.7 15 8.5 2.5 2.3 15
1-2 11.7 2.1 3.5 20 11.0 2.1 2.4 15
3-5 16.2 2.1 1.5 10 16.2 2.2 2.0 10
6-7 22.0 2.5 2.1 15 22.0 2.5 2.8 20
8-9 27.5 3.4 2.5 25 27.2 3.1 3.2 25
10-11 35.5 4.5 3.0 35 34.5 4.1 2.6 30
12-14 48.0 4.2 1.5 20 46.0 3.1 3.0 25
15-17 58.4 2.0 1.9 10 50.6 0.8 4.7 10

妊婦

 妊婦の推定エネルギー必要量は下式で求めます.妊娠末期の体重増加量を 11 kg と仮定しています.妊婦のエネルギー付加量は初期で 50 kcal/d, 中期で 250 kcal/d, 後期で 450 kcal/d です.

\displaystyle \mathrm{EER\ of\ pregnant\ (kcal/d)} \\  = \mathrm{EER\ before\ pregnancy\ (kcal/d)} + \mathrm{AE\ (kcal/d)}\\  \\  \mathrm{AE\ :\ additional\ energy}

授乳婦

 授乳婦の推定エネルギー量は下式で求めます.授乳婦のエネルギー付加量は 350 kcal/d です.母乳のエネルギー含有量は 663 kcal/L です.

\displaystyle \mathrm{EER\ of\ nursing\ women\ (kcal/d)} \\  = \mathrm{EER\ before\ pregnancy\ (kcal/d)} + \mathrm{AE\ (kcal/d)}

身体活動レベル

 身体活動レベルの指標として 1 日のエネルギー消費量を基礎代謝量で除した PAL (physical activity level) という指標があります.このエネルギー消費量を測定する方法が二重標識水法です.水分子の構成成分である水素原子は通常 1 個の陽子であり,原子量は 1 です.酸素原子の原子量は通常 16 です.これらの安定同位体がそれぞれ原子量 2 の重水素および原子量 17 または 18 の重酸素です.この安定同位体からなる二重標識水を飲み,尿中に排泄される重酸素と重水素の濃度の比の変化量からエネルギー消費量を計測するのが二重標識水法であり,自由に生活している状態のエネルギー消費量を最も正確に測定できる方法です.

 2015 年版における身体活動レベルは下記のとおりです.2010 年版との違いは 12 – 14 歳の年齢階級の身体活動レベルをそれぞれ 0.05 引き上げたことです.身体活動レベルごとに 25 パーセンタイル値 (1.60) および 75 パーセンタイル値 (1.90) で集団を三分割し,低い順から I, II, III に分類しました.それぞれの代表値は 1.50, 1.75 2.00 となります.

2015 年版:年齢階級別に見た身体活動レベルの群分け(男女共通)
身体活動レベル レベル I (低い) レベル II (ふつう) レベル III (高い)
1-2 1.35
3-5 1.45
6-7 1.35 1.55 1.75
8-9 1.40 1.60 1.80
10-11 1.45 1.65 1.85
12-14 1.50 1.70 1.90
15-17 1.55 1.75 1.95
18-29 1.50 1.75 2.00
30-49 1.50 1.75 2.00
50-69 1.50 1.75 2.00
70- 1.45 1.70 1.95

 2010 年版における身体活動レベルは下記のとおりです.

2010 年版:年齢階級別に見た身体活動レベルの群分け(男女共通)
身体活動レベル レベル I (低い) レベル II (ふつう) レベル III (高い)
1-2 1.35
3-5 1.45
6-7 1.35 1.55 1.75
8-9 1.40 1.60 1.80
10-11 1.45 1.65 1.85
12-14 1.45 1.65 1.85
15-17 1.55 1.75 1.95
18-29 1.50 1.75 2.00
30-49 1.50 1.75 2.00
50-69 1.50 1.75 2.00
70- 1.45 1.70 1.95

参照:
日本人の食事摂取基準(2015 年版)エネルギー (pdf)
日本人の食事摂取基準(2010 年版)エネルギー (pdf)

Predictive Equations of Basal Metabolic Rate

Basal metabolic rate (BMR) is the minimal energy in awake. The basal metabolism reference value and the predictive equations of National Institute of Health and Nutrition are reliable in Japanese and the predictive equations of Schofield and FAO/WHO/UNU are internationally common, respectively.

Curiously, the result was too small when I assigned weight and height into predictive equation of FAO/WHO/UNU in the age group of 18-29 year-old female. Although I have obtained the original article and reviewed the contents, I could not find the predictive equations. They seem to calculate BMR from Schofield’s predictive equations.

Predictive equations for BMR (upper: male, lower: female)
Name Age Equation
National Institute of Health and Nutrition (0.0481 \times W + 0.0234 \times H - 0.0138 \times A - 0.4235) \times 1000/4.186
(0.0481 \times W + 0.0234 \times H - 0.0138 \times A - 0.9708) \times 1000/4.186
Harris-Benedict 66.4730 + 13.7516 \times W + 5.0033 \times H - 6.7550 \times A
655.0955 + 9.5634 \times W + 1.8496 \times H - 4.6756 \times A
Schofield <3 (0.249 \times W - 0.127) \times 1000/4.186
(0.244 \times W - 0.130) \times 1000/4.186
3-10 (0.095 \times W + 2.110) \times 1000/4.186
(0.085 \times W + 2.033) \times 1000/4.186
10-18 (0.074 \times W + 2.754) \times 1000/4.186
(0.056 \times W + 2.898) \times 1000/4.186
18-29 (0.063 \times W + 2.896) \times 1000/4.186
(0.062 \times W + 2.036) \times 1000/4.186
30-59 (0.048 \times W + 3.653) \times 1000/4.186
(0.034 \times W + 3.538) \times 1000/4.186
60- (0.049 \times W + 2.459) \times 1000/4.186
(0.038 \times W + 2.755) \times 1000/4.186
FAO/WHO/UNU 18-29 (64.4 \times W - 113.0 \times H/100 + 3000)/4.186
(55.6 \times W - 1397.4 \times H/100 + 148)/4.186
30-59 (47.2 \times W + 66.9 \times H/100 + 3769)/4.186
(36.4 \times W + 104.6 \times H/100 + 3619)/4.186
60- (36.8 \times W + 4719.5 \times H/100 - 4481)/4.186
(38.5 \times W + 2665.2 \times H/100 - 1264)/4.186
W\mathrm{:\ weight\ (kg)},\ H\mathrm{:\ height\ (cm)},\ A\mathrm{:\ age\ (years)}

Reference:
The Dietary Reference Intakes for Japanese 2015 edition Energy (pdf)
The Dietary Reference Intakes for Japanese 2010 edition Energy (pdf)

基礎代謝量の推定式

 基礎代謝量とは覚醒状態で必要な最小限のエネルギーです.日本人においては基礎代謝基準値と国立健康・栄養研究所の式は妥当性が高いとされていますが,国際的には Schofield や FAO/WHO/UNU の推定式が一般的です.

 FAO/WHO/UNU の推定式で年齢階級 18-29 歳の女性の推定式ですが,実際に値を当てはめて計算してみると奇妙なことにあり得ないほど小さな値が出ます.原著にあたってみましたが推定式そのものは見当たらず,Schofield の推定式をもとに基礎代謝量を計算しているようです.

基礎代謝量の推定式(上段:男性 下段:女性)
名称 年齢 推定式
国立健康・栄養研究所 (0.0481 \times W + 0.0234 \times H - 0.0138 \times A - 0.4235) \times 1000/4.186
(0.0481 \times W + 0.0234 \times H - 0.0138 \times A - 0.9708) \times 1000/4.186
Harris-Benedict 66.4730 + 13.7516 \times W + 5.0033 \times H - 6.7550 \times A
655.0955 + 9.5634 \times W + 1.8496 \times H - 4.6756 \times A
Schofield <3 (0.249 \times W - 0.127) \times 1000/4.186
(0.244 \times W - 0.130) \times 1000/4.186
3-10 (0.095 \times W + 2.110) \times 1000/4.186
(0.085 \times W + 2.033) \times 1000/4.186
10-18 (0.074 \times W + 2.754) \times 1000/4.186
(0.056 \times W + 2.898) \times 1000/4.186
18-29 (0.063 \times W + 2.896) \times 1000/4.186
(0.062 \times W + 2.036) \times 1000/4.186
30-59 (0.048 \times W + 3.653) \times 1000/4.186
(0.034 \times W + 3.538) \times 1000/4.186
60- (0.049 \times W + 2.459) \times 1000/4.186
(0.038 \times W + 2.755) \times 1000/4.186
FAO/WHO/UNU 18-29 (64.4 \times W - 113.0 \times H/100 + 3000)/4.186
(55.6 \times W - 1397.4 \times H/100 + 148)/4.186
30-59 (47.2 \times W + 66.9 \times H/100 + 3769)/4.186
(36.4 \times W + 104.6 \times H/100 + 3619)/4.186
60- (36.8 \times W + 4719.5 \times H/100 - 4481)/4.186
(38.5 \times W + 2665.2 \times H/100 - 1264)/4.186
W\mathrm{:\ weight\ (kg)},\ H\mathrm{:\ height\ (cm)},\ A\mathrm{:\ age\ (years)}

参照:
日本人の食事摂取基準(2015 年版)エネルギー (pdf)
日本人の食事摂取基準(2010 年版)エネルギー (pdf)

Reference physique

HeightWeight

Reference physique in 2015 edition

Refer to the congruence commission for standard value of the Japanese Society for Pediatric Endocrinology and the Japanese Society for auxology in 0-17 years old. Refer to the National Health and Nutrition Examination Survey in 2010 and 2011 in 18 years old or elder.

Gender Male Female
Age Reference height (cm) Reference weight (kg) Reference height (cm) Reference weight (kg)
0-5 M 61.5 6.3 60.1 5.9
6-11 M 71.6 8.8 70.2 8.1
6-8 M 69.8 8.4 68.3 7.8
9-11 M 73.2 9.1 71.9 8.4
1-2 85.8 11.5 84.6 11.0
3-5 103.6 16.5 103.2 16.1
6-7 119.5 22.2 118.3 21.9
8-9 130.4 28.0 130.4 27.4
10-11 142.0 35.6 144.0 36.3
12-14 160.5 49.0 155.1 47.5
15-17 170.1 59.7 157.7 51.9
18-29 170.3 68.5 158.0 53.1
30-49 170.7 68.5 158.0 53.1
50-69 166.6 65.3 153.5 53.0
70- 160.8 60.0 148.0 49.5
Standard physique in 2010 edition

Refer to the National Health and Nutrition Examination Survey in 2005 and 2006 in 1 year old or elder. Refer to the Infant Physical Development Research in 2000 in less than 1 year old.

Gender Male Female
Age Standard height (cm) Standard weight (kg) Standard height (cm) Standard weight (kg)
0-5 M 61.5 6.4 60.0 5.9
6-11 M 71.5 8.8 69.9 8.2
6-8 M 69.7 8.5 68.1 7.8
9-11 M 73.2 9.1 71.6 8.5
1-2 85.0 11.7 84.0 11.0
3-5 103.4 16.2 103.2 16.2
6-7 120.0 22.0 118.6 22.0
8-9 130.0 27.5 130.2 27.2
10-11 142.9 35.5 141.4 34.5
12-14 159.6 48.0 155.0 46.0
15-17 170.0 58.4 157.0 50.6
18-29 171.4 63.0 158.0 50.6
30-49 170.5 68.5 158.0 53.0
50-69 165.7 65.0 153.0 53.6
70- 161.0 59.7 147.5 49.0

Reference:
The Dietary Reference Intakes for Japanese 2015 edition Review (pdf)
The Dietary Reference Intakes for Japanese 2010 edition Basic Theory (pdf)

参照体位

HeightWeight

2015 年版参照体位

 0-17 歳は日本小児科内分泌学会・日本成長学会合同標準値委員会による小児の体格評価に用いる身長・体重の標準値をもとに年齢区分に応じて,当該月齢並びに年齢階級の中央時点における中央値を引用したとのことです.18 歳以上は平成 22 年 23 年国民健康・栄養調査における当該の性および年齢階級における身長・体重の中央値を用いたとのことです.

性別 男性 女性
年齢 参照身長 (cm) 参照体重 (kg) 参照身長 (cm) 参照体重 (kg)
0-5 (M) 61.5 6.3 60.1 5.9
6-11 (M) 71.6 8.8 70.2 8.1
6-8 (M) 69.8 8.4 68.3 7.8
9-11 (M) 73.2 9.1 71.9 8.4
1-2 85.8 11.5 84.6 11.0
3-5 103.6 16.5 103.2 16.1
6-7 119.5 22.2 118.3 21.9
8-9 130.4 28.0 130.4 27.4
10-11 142.0 35.6 144.0 36.3
12-14 160.5 49.0 155.1 47.5
15-17 170.1 59.7 157.7 51.9
18-29 170.3 68.5 158.0 53.1
30-49 170.7 68.5 158.0 53.1
50-69 166.6 65.3 153.5 53.0
70- 160.8 60.0 148.0 49.5
2010 年版基準体位

  1 歳以上は平成 17 年及び 18 年国民健康・栄養調査における当該年齢階級における中央値(17 歳以下は各年齢の加重が等しくなるように調整),1 歳未満は平成 12 年乳幼児身体発育調査の身長及び体重発育パーセンタイル曲線の当該の月齢における中央値を用いたとのことです.

性別 男性 女性
年齢 基準身長 (cm) 基準体重 (kg) 基準身長 (cm) 基準体重 (kg)
0-5 (M) 61.5 6.4 60.0 5.9
6-11 (M) 71.5 8.8 69.9 8.2
6-8 (M) 69.7 8.5 68.1 7.8
9-11 (M) 73.2 9.1 71.6 8.5
1-2 85.0 11.7 84.0 11.0
3-5 103.4 16.2 103.2 16.2
6-7 120.0 22.0 118.6 22.0
8-9 130.0 27.5 130.2 27.2
10-11 142.9 35.5 141.4 34.5
12-14 159.6 48.0 155.0 46.0
15-17 170.0 58.4 157.0 50.6
18-29 171.4 63.0 158.0 50.6
30-49 170.5 68.5 158.0 53.0
50-69 165.7 65.0 153.0 53.6
70- 161.0 59.7 147.5 49.0

参照:
日本人の食事摂取基準(2015 年版)総論 (pdf)
日本人の食事摂取基準(2010 年版)策定の基礎理論 (pdf)

Dietary Reference Intakes for Japanese 2015 edition

Ministry of Health, Labour and Wealth (MLH) of Japan has published ‘The Dietary Reference Intakes for Japanese (2015 edition)’.

The Dietary Reference Intakes for Japanese

日本人の食事摂取基準2015年版

 厚生労働省から日本人の食事摂取基準(2015 年版)が公表されました.2010 年版と比較して変更したところなどを述べていく予定です.

日本人の食事摂取基準